|
Download Data (XLS File) |
|
||||||||
|
||||||||
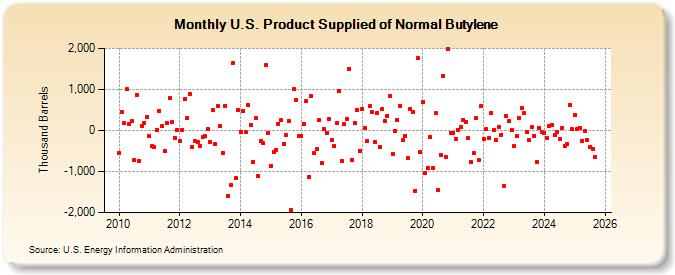
| U.S. Product Supplied of Normal Butylene (Thousand Barrels) | ||||||||
| Year | Jan | Feb | Mar | Apr | May | Jun | Jul | Aug | Sep | Oct | Nov | Dec |
|---|---|---|---|---|---|---|---|---|---|---|---|---|
| 2010 | -552 | 449 | 174 | 1,000 | 160 | 236 | -728 | 874 | -738 | 115 | 188 | 338 |
| 2011 | -138 | -380 | -408 | 22 | 477 | 113 | -488 | 170 | 796 | 198 | -177 | 18 |
| 2012 | -255 | 18 | 758 | 298 | 897 | -393 | -266 | -269 | -377 | -167 | -144 | 43 |
| 2013 | -276 | 501 | -319 | 601 | 106 | -537 | 601 | -1,600 | -1,329 | 1,643 | -1,165 | 503 |
| 2014 | -26 | 470 | -37 | 623 | 143 | -760 | 306 | -1,120 | -264 | -313 | 1,597 | -51 |
| 2015 | -863 | -529 | -464 | 168 | 251 | -318 | -112 | 233 | -1,945 | 1,008 | 749 | -145 |
| 2016 | -131 | 159 | 708 | -1,123 | 831 | -559 | -455 | 250 | -803 | 29 | -53 | 268 |
| 2017 | -241 | -375 | 189 | 959 | -733 | 154 | 269 | 1,509 | -710 | 186 | 491 | -497 |
| 2018 | 525 | 69 | -257 | 585 | 451 | -281 | 429 | -395 | 528 | 232 | 360 | 849 |
| 2019 | -572 | -3 | 255 | 607 | -240 | -129 | -661 | 531 | 461 | -1,468 | 1,757 | -532 |
| 2020 | 700 | -1,040 | -910 | -151 | -905 | 417 | -1,444 | -587 | 1,334 | -645 | 1,980 | -50 |
| 2021 | -50 | -206 | 13 | 74 | 262 | 213 | -186 | -764 | -547 | 313 | -729 | 588 |
| 2022 | -207 | 27 | -175 | 417 | 17 | -231 | 74 | -100 | -1,349 | 361 | 241 | 15 |
| 2023 | -442 | -123 | 307 | 545 | 416 | -44 | -241 | 74 | -125 | -771 | 59 | -39 |
| 2024 | -50 | |||||||||||
| - = No Data Reported; -- = Not Applicable; NA = Not Available; W = Withheld to avoid disclosure of individual company data. |
| Release Date: 3/29/2024 |
| Next Release Date: 4/30/2024 |