|
Download Data (XLS File) |
|
||||||||
|
||||||||
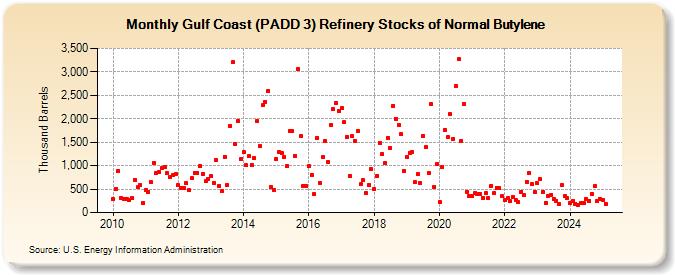
| Gulf Coast (PADD 3) Refinery Stocks of Normal Butylene (Thousand Barrels) | ||||||||
| Year | Jan | Feb | Mar | Apr | May | Jun | Jul | Aug | Sep | Oct | Nov | Dec |
|---|---|---|---|---|---|---|---|---|---|---|---|---|
| 2010 | 293 | 510 | 896 | 313 | 289 | 291 | 269 | 300 | 704 | 536 | 586 | 210 |
| 2011 | 483 | 440 | 649 | 1,066 | 845 | 872 | 945 | 971 | 837 | 761 | 795 | 820 |
| 2012 | 584 | 530 | 519 | 625 | 473 | 729 | 846 | 852 | 989 | 826 | 665 | 726 |
| 2013 | 770 | 636 | 1,119 | 568 | 451 | 1,195 | 581 | 1,856 | 3,204 | 1,456 | 1,960 | 1,141 |
| 2014 | 1,293 | 1,007 | 1,196 | 1,022 | 1,159 | 1,946 | 1,412 | 2,287 | 2,358 | 2,593 | 549 | 482 |
| 2015 | 1,143 | 1,290 | 1,260 | 1,191 | 987 | 1,741 | 1,736 | 1,207 | 3,059 | 1,624 | 570 | 565 |
| 2016 | 989 | 809 | 397 | 1,591 | 634 | 1,183 | 1,529 | 1,079 | 1,869 | 2,206 | 2,331 | 2,163 |
| 2017 | 2,226 | 1,930 | 1,616 | 786 | 1,625 | 1,525 | 1,736 | 601 | 684 | 408 | 588 | 925 |
| 2018 | 500 | 788 | 1,475 | 1,253 | 1,046 | 1,587 | 1,378 | 2,278 | 2,000 | 1,866 | 1,667 | 895 |
| 2019 | 1,182 | 1,270 | 1,285 | 645 | 822 | 630 | 1,639 | 1,397 | 840 | 2,308 | 552 | 1,030 |
| 2020 | 227 | 971 | 1,768 | 1,610 | 2,096 | 1,569 | 2,695 | 3,269 | 1,533 | 2,317 | 448 | 363 |
| 2021 | 348 | 411 | 401 | 398 | 315 | 407 | 308 | 574 | 414 | 532 | 519 | 343 |
| 2022 | 260 | 309 | 241 | 323 | 270 | 225 | 447 | 372 | 660 | 842 | 603 | 437 |
| 2023 | 623 | 710 | 436 | 207 | 363 | 381 | 291 | 254 | 180 | 582 | 345 | 305 |
| 2024 | 202 | |||||||||||
| - = No Data Reported; -- = Not Applicable; NA = Not Available; W = Withheld to avoid disclosure of individual company data. |
| Release Date: 3/29/2024 |
| Next Release Date: 4/30/2024 |