|
Download Data (XLS File) |
|
||||||||
|
||||||||
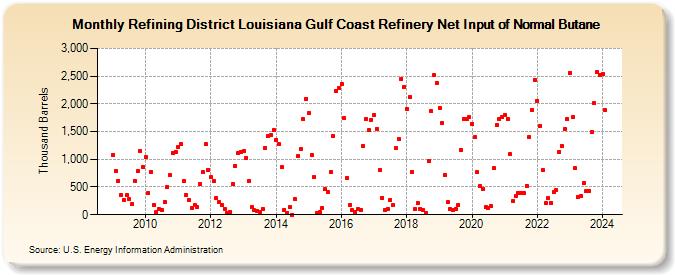
| Refining District Louisiana Gulf Coast Refinery Net Input of Normal Butane (Thousand Barrels) | ||||||||
| Year | Jan | Feb | Mar | Apr | May | Jun | Jul | Aug | Sep | Oct | Nov | Dec |
|---|---|---|---|---|---|---|---|---|---|---|---|---|
| 2009 | 1,082 | 797 | 611 | 351 | 269 | 353 | 276 | 194 | 609 | 782 | 1,153 | 863 |
| 2010 | 1,043 | 395 | 773 | 178 | 50 | 99 | 81 | 237 | 502 | 716 | 1,118 | 1,139 |
| 2011 | 1,220 | 1,283 | 600 | 356 | 265 | 128 | 170 | 143 | 547 | 765 | 1,269 | 815 |
| 2012 | 675 | 604 | 299 | 225 | 180 | 111 | 30 | 56 | 556 | 887 | 1,109 | 1,140 |
| 2013 | 1,146 | 1,030 | 602 | 133 | 78 | 70 | 46 | 108 | 1,207 | 1,427 | 1,433 | 1,531 |
| 2014 | 1,353 | 1,267 | 854 | 86 | 33 | 134 | 1 | 276 | 1,062 | 1,184 | 1,720 | 2,093 |
| 2015 | 1,832 | 1,073 | 683 | 39 | 40 | 123 | 456 | 404 | 767 | 1,414 | 2,229 | 2,290 |
| 2016 | 2,362 | 1,744 | 666 | 179 | 80 | 52 | 96 | 79 | 1,239 | 1,722 | 1,519 | 1,713 |
| 2017 | 1,798 | 1,554 | 803 | 306 | 87 | 111 | 267 | 172 | 1,195 | 1,374 | 2,455 | 2,300 |
| 2018 | 1,910 | 2,121 | 768 | 102 | 212 | 101 | 87 | 38 | 963 | 1,866 | 2,513 | 2,384 |
| 2019 | 1,932 | 1,657 | 716 | 227 | 103 | 77 | 104 | 172 | 1,176 | 1,726 | 1,722 | 1,755 |
| 2020 | 1,641 | 1,395 | 766 | 511 | 464 | 132 | 121 | 153 | 840 | 1,615 | 1,723 | 1,757 |
| 2021 | 1,805 | 1,728 | 1,087 | 245 | 329 | 399 | 396 | 386 | 523 | 1,402 | 1,894 | 2,438 |
| 2022 | 2,059 | 1,598 | 810 | 204 | 296 | 220 | 405 | 438 | 1,138 | 1,235 | 1,548 | 1,718 |
| 2023 | 2,565 | 1,759 | 837 | 327 | 335 | 567 | 424 | 435 | 1,487 | 2,007 | 2,580 | 2,522 |
| 2024 | 2,537 | 1,883 | 809 | 289 | ||||||||
| - = No Data Reported; -- = Not Applicable; NA = Not Available; W = Withheld to avoid disclosure of individual company data. |
| Release Date: 6/28/2024 |
| Next Release Date: 7/31/2024 |