|
Download Data (XLS File) |
|
||||||||
|
||||||||
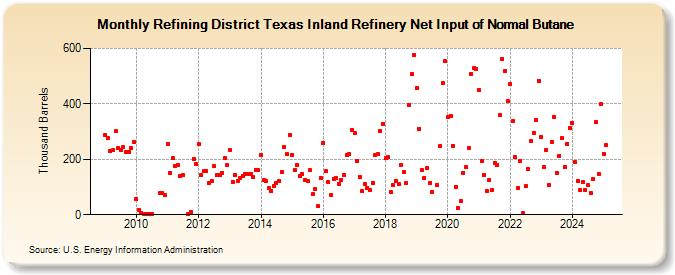
| Refining District Texas Inland Refinery Net Input of Normal Butane (Thousand Barrels) | ||||||||
| Year | Jan | Feb | Mar | Apr | May | Jun | Jul | Aug | Sep | Oct | Nov | Dec |
|---|---|---|---|---|---|---|---|---|---|---|---|---|
| 2009 | 287 | 275 | 230 | 232 | 301 | 239 | 235 | 243 | 225 | 228 | 240 | 263 |
| 2010 | 56 | 18 | 6 | 2 | 1 | 1 | 4 | 78 | 78 | 70 | ||
| 2011 | 255 | 152 | 203 | 175 | 180 | 141 | 143 | 3 | 9 | 201 | 184 | |
| 2012 | 255 | 142 | 156 | 157 | 114 | 121 | 174 | 143 | 142 | 151 | 203 | 178 |
| 2013 | 235 | 119 | 144 | 122 | 134 | 141 | 147 | 148 | 146 | 135 | 163 | 161 |
| 2014 | 215 | 124 | 122 | 97 | 85 | 104 | 114 | 120 | 155 | 245 | 219 | 288 |
| 2015 | 216 | 161 | 178 | 138 | 147 | 125 | 122 | 160 | 74 | 92 | 30 | 133 |
| 2016 | 258 | 156 | 117 | 70 | 130 | 132 | 112 | 126 | 145 | 214 | 218 | 307 |
| 2017 | 295 | 195 | 137 | 85 | 111 | 96 | 90 | 115 | 216 | 218 | 302 | 329 |
| 2018 | 205 | 207 | 83 | 108 | 122 | 109 | 178 | 154 | 114 | 394 | 508 | 577 |
| 2019 | 458 | 311 | 161 | 134 | 170 | 116 | 83 | 107 | 247 | 475 | 553 | |
| 2020 | 351 | 357 | 249 | 101 | 24 | 49 | 152 | 171 | 239 | 509 | 529 | 525 |
| 2021 | 451 | 193 | 145 | 87 | 125 | 89 | 187 | 180 | 359 | 563 | 520 | 410 |
| 2022 | 472 | 337 | 207 | 98 | 193 | 5 | 102 | 165 | 266 | 296 | 340 | 484 |
| 2023 | 281 | 172 | 233 | 106 | 264 | 352 | 152 | 213 | 275 | 172 | 256 | 313 |
| 2024 | 332 | |||||||||||
| - = No Data Reported; -- = Not Applicable; NA = Not Available; W = Withheld to avoid disclosure of individual company data. |
| Release Date: 3/29/2024 |
| Next Release Date: 4/30/2024 |
Referring Pages: