|
Download Data (XLS File) |
|
||||||||
|
||||||||
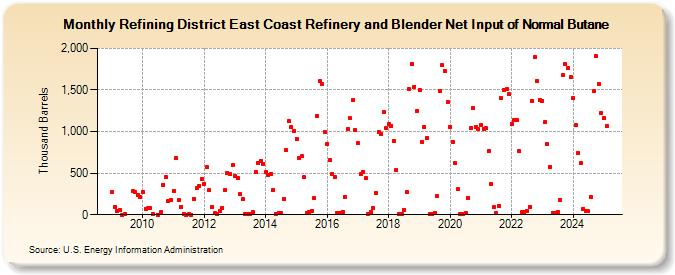
| Refining District East Coast Refinery and Blender Net Input of Normal Butane (Thousand Barrels) | ||||||||
| Year | Jan | Feb | Mar | Apr | May | Jun | Jul | Aug | Sep | Oct | Nov | Dec |
|---|---|---|---|---|---|---|---|---|---|---|---|---|
| 2009 | 271 | 98 | 45 | 54 | 1 | 3 | 285 | 271 | 233 | 214 | ||
| 2010 | 278 | 73 | 80 | 77 | 5 | 1 | 28 | 362 | 449 | 170 | 171 | |
| 2011 | 291 | 680 | 173 | 97 | 9 | 1 | 6 | 2 | 191 | 319 | 351 | 434 |
| 2012 | 375 | 570 | 294 | 90 | 16 | 4 | 43 | 84 | 296 | 506 | 484 | 593 |
| 2013 | 462 | 446 | 252 | 184 | 3 | 12 | 6 | 32 | 518 | 626 | 650 | 613 |
| 2014 | 516 | 472 | 494 | 301 | 12 | 24 | 20 | 194 | 776 | 1,122 | 1,060 | 1,004 |
| 2015 | 911 | 679 | 704 | 448 | 20 | 27 | 45 | 198 | 1,185 | 1,604 | 1,568 | 990 |
| 2016 | 852 | 656 | 494 | 453 | 15 | 26 | 30 | 217 | 1,027 | 1,157 | 1,379 | 1,018 |
| 2017 | 858 | 485 | 513 | 436 | 13 | 30 | 80 | 266 | 992 | 976 | 1,231 | 1,038 |
| 2018 | 1,091 | 1,072 | 887 | 533 | 7 | 13 | 62 | 271 | 1,508 | 1,811 | 1,540 | 1,244 |
| 2019 | 1,497 | 878 | 1,055 | 926 | 4 | 11 | 22 | 222 | 1,487 | 1,796 | 1,725 | 1,355 |
| 2020 | 1,057 | 875 | 616 | 306 | 5 | 3 | 22 | 199 | 1,038 | 1,278 | 1,055 | 1,025 |
| 2021 | 1,078 | 1,032 | 1,038 | 764 | 373 | 88 | 18 | 105 | 1,398 | 1,500 | 1,507 | 1,447 |
| 2022 | 1,096 | 1,139 | 1,142 | 762 | 32 | 31 | 43 | 93 | 1,371 | 1,896 | 1,606 | 1,385 |
| 2023 | 1,367 | 1,112 | 844 | 574 | 21 | 26 | 36 | 176 | 1,663 | 1,763 | 1,734 | 1,651 |
| 2024 | 1,405 | |||||||||||
| - = No Data Reported; -- = Not Applicable; NA = Not Available; W = Withheld to avoid disclosure of individual company data. |
| Release Date: 3/29/2024 |
| Next Release Date: 4/30/2024 |