|
Download Data (XLS File) |
|
||||||||
|
||||||||
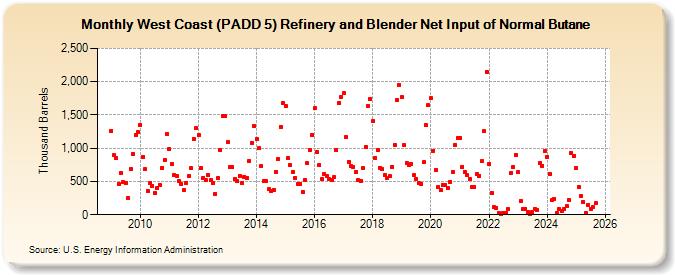
| West Coast (PADD 5) Refinery and Blender Net Input of Normal Butane (Thousand Barrels) | ||||||||
| Year | Jan | Feb | Mar | Apr | May | Jun | Jul | Aug | Sep | Oct | Nov | Dec |
|---|---|---|---|---|---|---|---|---|---|---|---|---|
| 2009 | 1,261 | 892 | 852 | 459 | 625 | 486 | 470 | 248 | 688 | 918 | 1,197 | 1,239 |
| 2010 | 1,354 | 875 | 681 | 355 | 473 | 436 | 323 | 403 | 451 | 707 | 825 | 1,216 |
| 2011 | 986 | 756 | 595 | 586 | 505 | 455 | 365 | 479 | 581 | 700 | 1,139 | 1,298 |
| 2012 | 1,191 | 695 | 552 | 518 | 593 | 517 | 476 | 313 | 550 | 969 | 1,487 | 1,485 |
| 2013 | 1,086 | 716 | 711 | 537 | 500 | 586 | 479 | 570 | 555 | 808 | 1,085 | 1,337 |
| 2014 | 1,138 | 997 | 725 | 503 | 502 | 381 | 349 | 374 | 643 | 837 | 1,324 | 1,675 |
| 2015 | 1,630 | 851 | 745 | 640 | 556 | 463 | 465 | 347 | 522 | 772 | 976 | 1,199 |
| 2016 | 1,597 | 941 | 746 | 537 | 612 | 579 | 534 | 521 | 561 | 972 | 1,681 | 1,771 |
| 2017 | 1,822 | 1,162 | 796 | 733 | 719 | 649 | 518 | 513 | 696 | 1,020 | 1,636 | 1,743 |
| 2018 | 1,402 | 858 | 971 | 707 | 681 | 592 | 559 | 580 | 721 | 1,048 | 1,721 | 1,949 |
| 2019 | 1,763 | 1,042 | 775 | 754 | 759 | 593 | 542 | 475 | 466 | 788 | 1,341 | 1,643 |
| 2020 | 1,748 | 965 | 672 | 415 | 365 | 442 | 450 | 397 | 496 | 639 | 1,048 | 1,152 |
| 2021 | 1,157 | 721 | 645 | 593 | 544 | 420 | 412 | 609 | 588 | 807 | 1,253 | 2,151 |
| 2022 | 769 | 332 | 112 | 102 | 22 | 16 | 27 | 33 | 83 | 624 | 721 | 902 |
| 2023 | 635 | 210 | 91 | 93 | 35 | 16 | 42 | 92 | 69 | 775 | 737 | 962 |
| 2024 | 875 | 613 | 214 | 241 | ||||||||
| - = No Data Reported; -- = Not Applicable; NA = Not Available; W = Withheld to avoid disclosure of individual company data. |
| Release Date: 6/28/2024 |
| Next Release Date: 7/31/2024 |