|
Download Data (XLS File) |
|
||||||||
|
||||||||
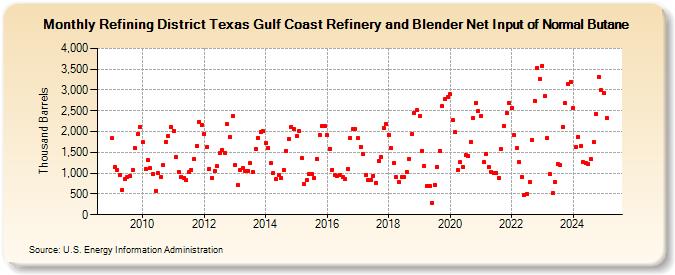
| Refining District Texas Gulf Coast Refinery and Blender Net Input of Normal Butane (Thousand Barrels) | ||||||||
| Year | Jan | Feb | Mar | Apr | May | Jun | Jul | Aug | Sep | Oct | Nov | Dec |
|---|---|---|---|---|---|---|---|---|---|---|---|---|
| 2009 | 1,841 | 1,147 | 1,076 | 951 | 604 | 867 | 916 | 943 | 1,067 | 1,600 | 1,948 | 2,117 |
| 2010 | 1,742 | 1,104 | 1,309 | 1,117 | 988 | 578 | 1,000 | 904 | 1,189 | 1,757 | 1,898 | 2,105 |
| 2011 | 2,025 | 1,392 | 1,029 | 917 | 890 | 823 | 1,018 | 1,077 | 1,332 | 1,660 | 2,239 | 2,161 |
| 2012 | 1,950 | 1,629 | 1,107 | 894 | 1,045 | 1,160 | 1,474 | 1,562 | 1,485 | 2,174 | 1,878 | 2,372 |
| 2013 | 1,195 | 710 | 1,072 | 1,121 | 1,050 | 1,059 | 1,235 | 1,016 | 1,588 | 1,851 | 1,991 | 2,008 |
| 2014 | 1,720 | 1,616 | 1,235 | 994 | 848 | 952 | 877 | 1,081 | 1,538 | 1,818 | 2,117 | 2,061 |
| 2015 | 1,888 | 2,012 | 1,366 | 737 | 826 | 970 | 982 | 884 | 1,341 | 1,918 | 2,131 | 2,122 |
| 2016 | 1,910 | 1,588 | 1,082 | 954 | 927 | 962 | 919 | 864 | 1,111 | 1,854 | 2,066 | 2,064 |
| 2017 | 1,833 | 1,635 | 1,454 | 954 | 843 | 843 | 940 | 767 | 1,293 | 1,380 | 2,075 | 2,190 |
| 2018 | 1,922 | 1,595 | 1,245 | 896 | 781 | 909 | 906 | 1,027 | 1,345 | 1,943 | 2,444 | 2,518 |
| 2019 | 2,364 | 1,535 | 1,167 | 690 | 690 | 289 | 724 | 1,150 | 1,537 | 2,606 | 2,776 | 2,834 |
| 2020 | 2,892 | 2,267 | 1,979 | 1,065 | 1,258 | 1,148 | 1,431 | 1,404 | 1,756 | 2,326 | 2,695 | 2,494 |
| 2021 | 2,378 | 1,257 | 1,470 | 1,153 | 1,027 | 1,011 | 1,011 | 885 | 1,574 | 2,142 | 2,451 | 2,696 |
| 2022 | 2,561 | 1,923 | 1,594 | 1,267 | 908 | 480 | 500 | 785 | 1,795 | 2,745 | 3,537 | 3,268 |
| 2023 | 3,583 | 2,845 | 1,844 | 977 | 520 | 785 | 1,217 | 1,200 | 2,112 | 2,670 | 3,111 | 3,169 |
| 2024 | 2,570 | |||||||||||
| - = No Data Reported; -- = Not Applicable; NA = Not Available; W = Withheld to avoid disclosure of individual company data. |
| Release Date: 3/29/2024 |
| Next Release Date: 4/30/2024 |