|
Download Data (XLS File) |
|
||||||||
|
||||||||
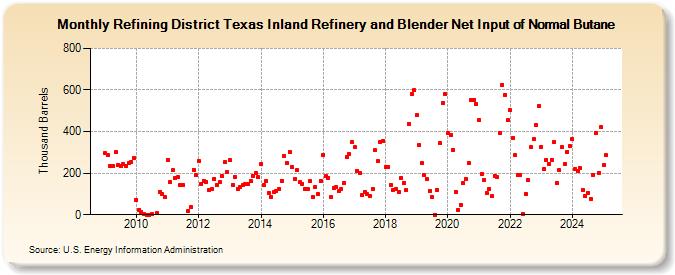
| Refining District Texas Inland Refinery and Blender Net Input of Normal Butane (Thousand Barrels) | ||||||||
| Year | Jan | Feb | Mar | Apr | May | Jun | Jul | Aug | Sep | Oct | Nov | Dec |
|---|---|---|---|---|---|---|---|---|---|---|---|---|
| 2009 | 295 | 285 | 233 | 232 | 301 | 240 | 235 | 243 | 232 | 248 | 255 | 275 |
| 2010 | 72 | 24 | 12 | 2 | 1 | 1 | 4 | 9 | 111 | 100 | 84 | |
| 2011 | 265 | 156 | 213 | 177 | 180 | 141 | 143 | 16 | 36 | 217 | 189 | |
| 2012 | 260 | 148 | 162 | 159 | 118 | 122 | 174 | 143 | 155 | 186 | 253 | 205 |
| 2013 | 263 | 145 | 182 | 125 | 134 | 142 | 147 | 148 | 163 | 185 | 202 | 179 |
| 2014 | 245 | 143 | 162 | 106 | 86 | 107 | 116 | 123 | 164 | 281 | 248 | 304 |
| 2015 | 230 | 174 | 215 | 155 | 149 | 125 | 122 | 160 | 86 | 134 | 98 | 163 |
| 2016 | 287 | 184 | 177 | 83 | 130 | 132 | 112 | 126 | 153 | 280 | 292 | 348 |
| 2017 | 325 | 212 | 202 | 94 | 111 | 98 | 90 | 124 | 310 | 256 | 351 | 354 |
| 2018 | 230 | 231 | 145 | 121 | 122 | 109 | 178 | 154 | 119 | 438 | 581 | 599 |
| 2019 | 478 | 336 | 248 | 189 | 170 | 116 | 83 | 1 | 121 | 346 | 537 | 581 |
| 2020 | 392 | 383 | 312 | 111 | 24 | 49 | 152 | 171 | 251 | 551 | 554 | 533 |
| 2021 | 456 | 198 | 165 | 104 | 125 | 89 | 187 | 180 | 395 | 625 | 578 | 454 |
| 2022 | 502 | 370 | 285 | 191 | 193 | 5 | 102 | 165 | 325 | 365 | 430 | 522 |
| 2023 | 327 | 220 | 265 | 244 | 265 | 352 | 152 | 213 | 324 | 244 | 303 | 330 |
| 2024 | 362 | |||||||||||
| - = No Data Reported; -- = Not Applicable; NA = Not Available; W = Withheld to avoid disclosure of individual company data. |
| Release Date: 3/29/2024 |
| Next Release Date: 4/30/2024 |