|
Download Data (XLS File) |
|
||||||||
|
||||||||
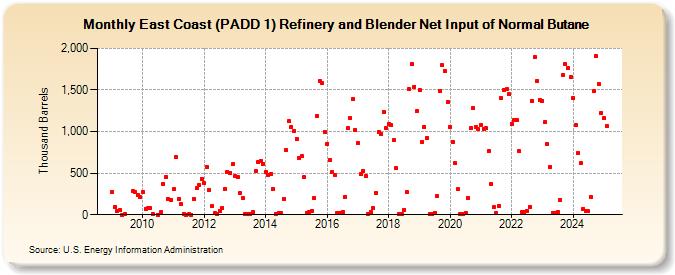
| East Coast (PADD 1) Refinery and Blender Net Input of Normal Butane (Thousand Barrels) | ||||||||
| Year | Jan | Feb | Mar | Apr | May | Jun | Jul | Aug | Sep | Oct | Nov | Dec |
|---|---|---|---|---|---|---|---|---|---|---|---|---|
| 2009 | 271 | 98 | 45 | 54 | 1 | 3 | 285 | 271 | 233 | 214 | ||
| 2010 | 278 | 73 | 80 | 77 | 5 | 1 | 28 | 374 | 456 | 184 | 181 | |
| 2011 | 304 | 694 | 190 | 125 | 9 | 1 | 6 | 2 | 194 | 319 | 359 | 435 |
| 2012 | 380 | 576 | 295 | 100 | 17 | 4 | 43 | 84 | 308 | 519 | 505 | 604 |
| 2013 | 462 | 449 | 257 | 203 | 3 | 12 | 6 | 32 | 523 | 628 | 651 | 614 |
| 2014 | 518 | 474 | 494 | 304 | 12 | 24 | 20 | 194 | 776 | 1,122 | 1,060 | 1,005 |
| 2015 | 911 | 679 | 705 | 449 | 20 | 27 | 45 | 198 | 1,189 | 1,610 | 1,580 | 996 |
| 2016 | 855 | 661 | 509 | 480 | 15 | 26 | 30 | 217 | 1,039 | 1,165 | 1,387 | 1,019 |
| 2017 | 861 | 485 | 524 | 466 | 13 | 30 | 80 | 266 | 992 | 976 | 1,241 | 1,043 |
| 2018 | 1,093 | 1,074 | 896 | 557 | 8 | 13 | 62 | 271 | 1,508 | 1,811 | 1,540 | 1,244 |
| 2019 | 1,497 | 878 | 1,055 | 926 | 4 | 11 | 22 | 222 | 1,487 | 1,796 | 1,725 | 1,355 |
| 2020 | 1,057 | 875 | 616 | 306 | 5 | 3 | 22 | 199 | 1,038 | 1,278 | 1,055 | 1,025 |
| 2021 | 1,078 | 1,032 | 1,038 | 764 | 373 | 88 | 19 | 105 | 1,398 | 1,500 | 1,507 | 1,447 |
| 2022 | 1,096 | 1,139 | 1,142 | 762 | 32 | 31 | 43 | 93 | 1,371 | 1,896 | 1,606 | 1,385 |
| 2023 | 1,367 | 1,112 | 844 | 574 | 21 | 26 | 36 | 176 | 1,663 | 1,763 | 1,734 | 1,651 |
| 2024 | 1,405 | |||||||||||
| - = No Data Reported; -- = Not Applicable; NA = Not Available; W = Withheld to avoid disclosure of individual company data. |
| Release Date: 3/29/2024 |
| Next Release Date: 4/30/2024 |