|
Download Data (XLS File) |
|
||||||||
|
||||||||
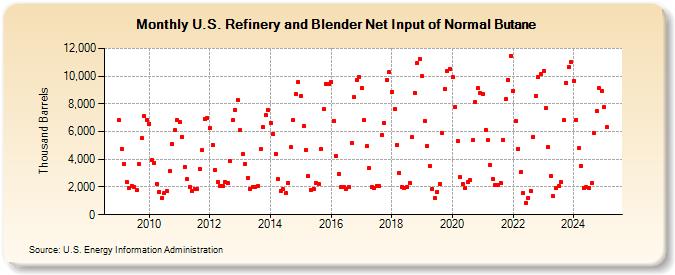
| U.S. Refinery and Blender Net Input of Normal Butane (Thousand Barrels) | ||||||||
| Year | Jan | Feb | Mar | Apr | May | Jun | Jul | Aug | Sep | Oct | Nov | Dec |
|---|---|---|---|---|---|---|---|---|---|---|---|---|
| 2009 | 6,805 | 4,753 | 3,664 | 2,345 | 1,931 | 2,102 | 2,027 | 1,774 | 3,636 | 5,518 | 7,097 | 6,857 |
| 2010 | 6,565 | 3,931 | 3,762 | 2,240 | 1,666 | 1,223 | 1,544 | 1,703 | 3,149 | 5,117 | 6,082 | 6,820 |
| 2011 | 6,695 | 5,620 | 3,462 | 2,576 | 2,007 | 1,685 | 1,864 | 1,826 | 3,332 | 4,645 | 6,891 | 6,968 |
| 2012 | 6,249 | 5,045 | 3,227 | 2,364 | 2,101 | 2,089 | 2,359 | 2,299 | 3,860 | 6,800 | 7,566 | 8,287 |
| 2013 | 6,104 | 4,346 | 3,669 | 2,669 | 1,881 | 1,998 | 2,014 | 2,084 | 4,710 | 6,304 | 7,181 | 7,564 |
| 2014 | 6,636 | 5,791 | 4,388 | 2,573 | 1,734 | 1,821 | 1,544 | 2,306 | 4,857 | 6,808 | 8,702 | 9,579 |
| 2015 | 8,569 | 6,391 | 4,699 | 2,787 | 1,802 | 1,879 | 2,324 | 2,192 | 4,720 | 7,613 | 9,427 | 9,410 |
| 2016 | 9,595 | 6,783 | 4,228 | 2,973 | 2,012 | 1,981 | 1,865 | 1,987 | 5,139 | 8,492 | 9,728 | 9,934 |
| 2017 | 9,148 | 6,833 | 4,929 | 3,358 | 2,028 | 1,926 | 2,080 | 2,064 | 5,752 | 6,644 | 9,743 | 10,274 |
| 2018 | 8,870 | 7,616 | 5,064 | 3,037 | 2,033 | 1,934 | 1,997 | 2,293 | 5,578 | 8,810 | 10,915 | 11,270 |
| 2019 | 10,006 | 6,772 | 4,922 | 3,518 | 1,886 | 1,222 | 1,657 | 2,200 | 5,893 | 9,082 | 10,390 | 10,492 |
| 2020 | 9,915 | 7,762 | 5,309 | 2,703 | 2,223 | 1,940 | 2,344 | 2,487 | 5,367 | 8,167 | 9,117 | 8,786 |
| 2021 | 8,674 | 6,119 | 5,355 | 3,598 | 2,582 | 2,146 | 2,153 | 2,319 | 5,418 | 8,345 | 9,731 | 11,475 |
| 2022 | 8,949 | 6,759 | 4,767 | 3,061 | 1,546 | 861 | 1,232 | 1,713 | 5,612 | 8,590 | 9,907 | 10,125 |
| 2023 | 10,362 | 7,692 | 4,888 | 2,802 | 1,326 | 1,897 | 2,068 | 2,323 | 6,784 | 9,480 | 10,601 | 10,965 |
| 2024 | 9,657 | |||||||||||
| - = No Data Reported; -- = Not Applicable; NA = Not Available; W = Withheld to avoid disclosure of individual company data. |
| Release Date: 3/29/2024 |
| Next Release Date: 4/30/2024 |