|
Download Data (XLS File) |
|
||||||||
|
||||||||
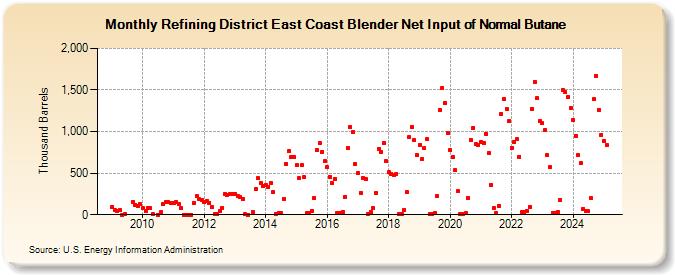
| Refining District East Coast Blender Net Input of Normal Butane (Thousand Barrels) | ||||||||
| Year | Jan | Feb | Mar | Apr | May | Jun | Jul | Aug | Sep | Oct | Nov | Dec |
|---|---|---|---|---|---|---|---|---|---|---|---|---|
| 2009 | 93 | 54 | 40 | 54 | 1 | 3 | 153 | 120 | 105 | 125 | ||
| 2010 | 78 | 42 | 80 | 77 | 5 | 1 | 28 | 123 | 152 | 151 | 135 | |
| 2011 | 143 | 157 | 133 | 75 | 2 | 1 | 1 | 2 | 144 | 220 | 188 | 178 |
| 2012 | 153 | 170 | 146 | 90 | 6 | 3 | 43 | 84 | 250 | 241 | 250 | 245 |
| 2013 | 250 | 222 | 209 | 184 | 3 | 2 | 32 | 308 | 438 | 382 | 342 | |
| 2014 | 358 | 337 | 387 | 271 | 12 | 24 | 19 | 192 | 612 | 761 | 697 | 700 |
| 2015 | 593 | 441 | 594 | 448 | 20 | 21 | 45 | 198 | 777 | 860 | 760 | 641 |
| 2016 | 569 | 458 | 378 | 435 | 15 | 21 | 30 | 217 | 802 | 1,052 | 991 | 607 |
| 2017 | 496 | 266 | 446 | 427 | 10 | 30 | 75 | 266 | 790 | 754 | 861 | 640 |
| 2018 | 509 | 491 | 483 | 485 | 7 | 13 | 58 | 270 | 930 | 1,055 | 898 | 717 |
| 2019 | 842 | 671 | 798 | 908 | 4 | 11 | 18 | 222 | 1,260 | 1,524 | 1,348 | 988 |
| 2020 | 778 | 689 | 534 | 281 | 5 | 3 | 19 | 199 | 899 | 1,047 | 846 | 841 |
| 2021 | 879 | 863 | 975 | 741 | 363 | 83 | 17 | 104 | 1,217 | 1,386 | 1,274 | 1,129 |
| 2022 | 807 | 880 | 906 | 700 | 32 | 31 | 43 | 93 | 1,275 | 1,601 | 1,398 | 1,128 |
| 2023 | 1,099 | 1,018 | 713 | 570 | 21 | 26 | 36 | 175 | 1,476 | 1,427 | 1,385 | 1,289 |
| 2024 | 1,140 | |||||||||||
| - = No Data Reported; -- = Not Applicable; NA = Not Available; W = Withheld to avoid disclosure of individual company data. |
| Release Date: 3/29/2024 |
| Next Release Date: 4/30/2024 |
Referring Pages: