|
Download Data (XLS File) |
|
||||||||
|
||||||||
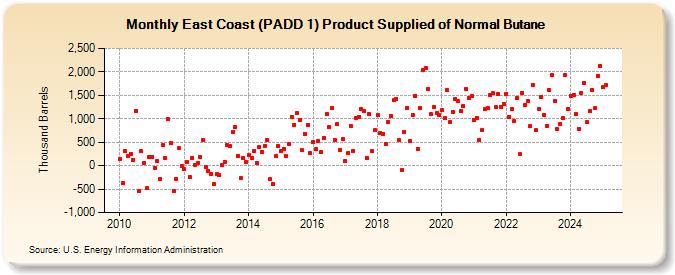
| East Coast (PADD 1) Product Supplied of Normal Butane (Thousand Barrels) | ||||||||
| Year | Jan | Feb | Mar | Apr | May | Jun | Jul | Aug | Sep | Oct | Nov | Dec |
|---|---|---|---|---|---|---|---|---|---|---|---|---|
| 2010 | 136 | -366 | 306 | 212 | 258 | 124 | 1,155 | -542 | 302 | 53 | -481 | 180 |
| 2011 | 190 | -43 | 102 | -295 | 430 | 162 | 997 | 492 | -538 | -278 | 368 | -11 |
| 2012 | -79 | 82 | -248 | 164 | 21 | 50 | 189 | 542 | -22 | -117 | -171 | -394 |
| 2013 | -182 | -196 | 13 | 81 | 437 | 419 | 710 | 820 | 208 | -267 | 158 | 78 |
| 2014 | 223 | 160 | 320 | 63 | 402 | 299 | 424 | 545 | -290 | -385 | 209 | 414 |
| 2015 | 313 | 354 | 211 | 453 | 1,038 | 870 | 1,121 | 980 | 324 | 683 | 877 | 260 |
| 2016 | 504 | 348 | 521 | 291 | 592 | 1,104 | 819 | 1,227 | 556 | 882 | 338 | 573 |
| 2017 | 90 | 272 | 856 | 318 | 1,025 | 1,041 | 1,202 | 1,165 | 171 | 1,091 | 306 | 754 |
| 2018 | 1,076 | 686 | 684 | 455 | 941 | 1,060 | 1,393 | 1,417 | 540 | -89 | 726 | 1,239 |
| 2019 | 515 | 1,080 | 1,489 | 356 | 1,224 | 2,037 | 2,085 | 1,631 | 1,095 | 1,259 | 1,118 | 1,084 |
| 2020 | 1,176 | 1,010 | 1,606 | 921 | 1,152 | 1,426 | 1,368 | 1,162 | 1,270 | 1,629 | 1,451 | 1,478 |
| 2021 | 972 | 1,022 | 542 | 751 | 1,212 | 1,219 | 1,516 | 1,544 | 1,241 | 1,531 | 1,259 | 1,308 |
| 2022 | 1,538 | 1,044 | 1,206 | 954 | 1,448 | 250 | 1,553 | 1,302 | 1,375 | 839 | 1,726 | 753 |
| 2023 | 1,202 | 1,474 | 1,082 | 852 | 1,620 | 1,925 | 1,377 | 789 | 893 | 1,011 | 1,942 | 1,214 |
| 2024 | 1,486 | 1,515 | 1,099 | 787 | 1,547 | 1,757 | 921 | 1,159 | 1,613 | 1,220 | 1,920 | 2,126 |
| 2025 | 1,670 | 1,714 | 1,364 | 1,583 | ||||||||
| - = No Data Reported; -- = Not Applicable; NA = Not Available; W = Withheld to avoid disclosure of individual company data. |
| Release Date: 6/30/2025 |
| Next Release Date: 7/31/2025 |