|
Download Data (XLS File) |
|
||||||||
|
||||||||
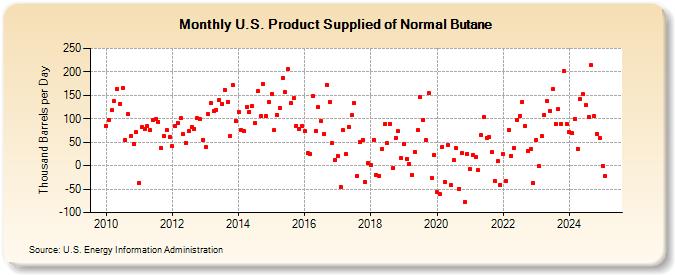
| U.S. Product Supplied of Normal Butane (Thousand Barrels per Day) | ||||||||
| Year | Jan | Feb | Mar | Apr | May | Jun | Jul | Aug | Sep | Oct | Nov | Dec |
|---|---|---|---|---|---|---|---|---|---|---|---|---|
| 2010 | 85 | 98 | 118 | 137 | 164 | 132 | 166 | 54 | 110 | 63 | 46 | 71 |
| 2011 | -36 | 82 | 79 | 84 | 76 | 97 | 99 | 94 | 37 | 63 | 75 | 61 |
| 2012 | 41 | 84 | 91 | 101 | 67 | 49 | 73 | 82 | 79 | 101 | 99 | 55 |
| 2013 | 40 | 110 | 133 | 116 | 119 | 141 | 132 | 162 | 136 | 64 | 171 | 96 |
| 2014 | 115 | 76 | 73 | 126 | 115 | 127 | 91 | 159 | 105 | 174 | 105 | 135 |
| 2015 | 153 | 75 | 108 | 123 | 187 | 157 | 205 | 134 | 144 | 85 | 78 | 85 |
| 2016 | 73 | 26 | 25 | 148 | 74 | 125 | 95 | 68 | 172 | 136 | 48 | 13 |
| 2017 | 21 | -45 | 75 | 25 | 83 | 107 | 134 | -22 | 50 | 55 | -35 | 6 |
| 2018 | 1 | 55 | -19 | -21 | 36 | 88 | 48 | 89 | -6 | 60 | 73 | 17 |
| 2019 | 46 | 15 | 4 | -19 | 30 | 75 | 146 | 98 | 54 | 154 | -26 | 23 |
| 2020 | -57 | -61 | 40 | -35 | 44 | -42 | 12 | 37 | -49 | 26 | -77 | 25 |
| 2021 | -8 | 23 | 18 | -10 | 65 | 103 | 60 | 61 | 29 | -33 | 9 | -41 |
| 2022 | 24 | -33 | 76 | 21 | 38 | 97 | 105 | 136 | 84 | 31 | 36 | -37 |
| 2023 | -15 | -132 | 25 | 29 | 122 | 94 | 135 | 58 | 69 | 99 | 196 | 81 |
| 2024 | 72 | |||||||||||
| - = No Data Reported; -- = Not Applicable; NA = Not Available; W = Withheld to avoid disclosure of individual company data. |
| Release Date: 3/29/2024 |
| Next Release Date: 4/30/2024 |