|
Download Data (XLS File) |
|
||||||||
|
||||||||
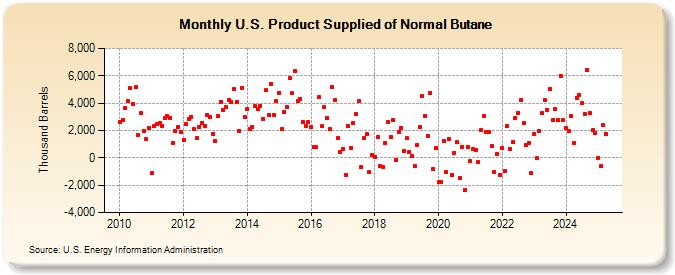
| U.S. Product Supplied of Normal Butane (Thousand Barrels) | ||||||||
| Year | Jan | Feb | Mar | Apr | May | Jun | Jul | Aug | Sep | Oct | Nov | Dec |
|---|---|---|---|---|---|---|---|---|---|---|---|---|
| 2010 | 2,627 | 2,735 | 3,649 | 4,119 | 5,073 | 3,968 | 5,144 | 1,680 | 3,291 | 1,952 | 1,393 | 2,213 |
| 2011 | -1,109 | 2,310 | 2,440 | 2,522 | 2,341 | 2,917 | 3,056 | 2,926 | 1,106 | 1,941 | 2,256 | 1,906 |
| 2012 | 1,282 | 2,438 | 2,808 | 3,015 | 2,074 | 1,481 | 2,276 | 2,551 | 2,356 | 3,118 | 2,974 | 1,716 |
| 2013 | 1,226 | 3,081 | 4,112 | 3,475 | 3,697 | 4,216 | 4,095 | 5,008 | 4,084 | 1,987 | 5,120 | 2,984 |
| 2014 | 3,570 | 2,128 | 2,254 | 3,782 | 3,577 | 3,820 | 2,816 | 4,937 | 3,146 | 5,405 | 3,146 | 4,173 |
| 2015 | 4,757 | 2,099 | 3,356 | 3,681 | 5,801 | 4,720 | 6,366 | 4,143 | 4,309 | 2,635 | 2,342 | 2,628 |
| 2016 | 2,265 | 768 | 765 | 4,443 | 2,306 | 3,738 | 2,948 | 2,123 | 5,175 | 4,201 | 1,451 | 391 |
| 2017 | 639 | -1,271 | 2,338 | 736 | 2,558 | 3,221 | 4,142 | -680 | 1,486 | 1,713 | -1,053 | 184 |
| 2018 | 26 | 1,527 | -595 | -645 | 1,113 | 2,645 | 1,499 | 2,753 | -186 | 1,859 | 2,191 | 524 |
| 2019 | 1,414 | 419 | 127 | -564 | 930 | 2,249 | 4,513 | 3,031 | 1,631 | 4,761 | -785 | 709 |
| 2020 | -1,776 | -1,773 | 1,247 | -1,037 | 1,369 | -1,250 | 381 | 1,134 | -1,472 | 799 | -2,320 | 776 |
| 2021 | -253 | 633 | 550 | -314 | 2,014 | 3,076 | 1,871 | 1,905 | 860 | -1,027 | 266 | -1,272 |
| 2022 | 755 | -930 | 2,348 | 628 | 1,164 | 2,897 | 3,266 | 4,216 | 2,533 | 952 | 1,083 | -1,133 |
| 2023 | -478 | -3,686 | 764 | 863 | 3,778 | 2,816 | 4,192 | 1,799 | 2,074 | 3,060 | 5,888 | 2,497 |
| 2024 | 2,217 | |||||||||||
| - = No Data Reported; -- = Not Applicable; NA = Not Available; W = Withheld to avoid disclosure of individual company data. |
| Release Date: 3/29/2024 |
| Next Release Date: 4/30/2024 |