|
Download Data (XLS File) |
|
||||||||
|
||||||||
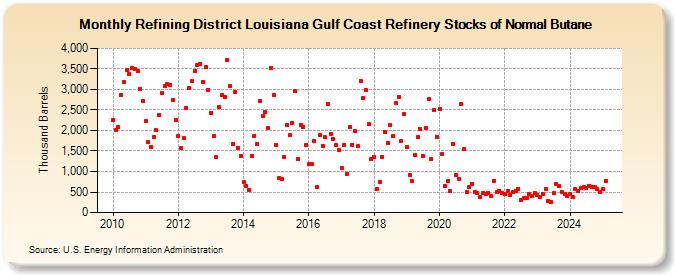
| Refining District Louisiana Gulf Coast Refinery Stocks of Normal Butane (Thousand Barrels) | ||||||||
| Year | Jan | Feb | Mar | Apr | May | Jun | Jul | Aug | Sep | Oct | Nov | Dec |
|---|---|---|---|---|---|---|---|---|---|---|---|---|
| 2010 | 2,258 | 2,009 | 2,074 | 2,872 | 3,185 | 3,467 | 3,380 | 3,534 | 3,505 | 3,458 | 3,012 | 2,712 |
| 2011 | 2,223 | 1,730 | 1,607 | 1,829 | 2,005 | 2,369 | 2,916 | 3,084 | 3,131 | 3,115 | 2,744 | 2,255 |
| 2012 | 1,877 | 1,566 | 1,806 | 2,550 | 3,045 | 3,200 | 3,445 | 3,593 | 3,621 | 3,183 | 3,557 | 2,994 |
| 2013 | 2,427 | 1,875 | 1,344 | 2,560 | 2,868 | 2,825 | 3,720 | 3,085 | 1,679 | 2,930 | 1,580 | 1,389 |
| 2014 | 752 | 656 | 559 | 1,384 | 1,877 | 1,670 | 2,728 | 2,342 | 2,444 | 2,067 | 3,532 | 2,862 |
| 2015 | 1,655 | 833 | 826 | 1,363 | 2,140 | 1,885 | 2,192 | 2,957 | 1,309 | 2,145 | 2,087 | 1,655 |
| 2016 | 1,175 | 1,178 | 1,750 | 632 | 1,885 | 1,623 | 1,832 | 2,633 | 1,913 | 1,787 | 1,646 | 1,523 |
| 2017 | 1,088 | 1,657 | 941 | 2,077 | 1,655 | 1,989 | 1,621 | 3,216 | 2,793 | 2,985 | 2,150 | 1,294 |
| 2018 | 1,345 | 563 | 756 | 1,359 | 1,952 | 1,695 | 2,125 | 1,856 | 2,663 | 2,823 | 1,733 | 2,391 |
| 2019 | 1,605 | 925 | 760 | 1,409 | 1,837 | 2,044 | 1,382 | 2,058 | 2,758 | 1,314 | 2,492 | 1,852 |
| 2020 | 2,530 | 1,419 | 658 | 774 | 517 | 1,681 | 917 | 823 | 2,657 | 1,545 | 510 | 613 |
| 2021 | 699 | 512 | 473 | 386 | 465 | 446 | 468 | 395 | 781 | 504 | 530 | 471 |
| 2022 | 456 | 525 | 436 | 509 | 515 | 577 | 314 | 343 | 351 | 446 | 403 | 485 |
| 2023 | 437 | 389 | 462 | 575 | 280 | 248 | 465 | 698 | 649 | 513 | 444 | 403 |
| 2024 | 454 | |||||||||||
| - = No Data Reported; -- = Not Applicable; NA = Not Available; W = Withheld to avoid disclosure of individual company data. |
| Release Date: 3/29/2024 |
| Next Release Date: 4/30/2024 |
Referring Pages: