|
Download Data (XLS File) |
|
||||||||
|
||||||||
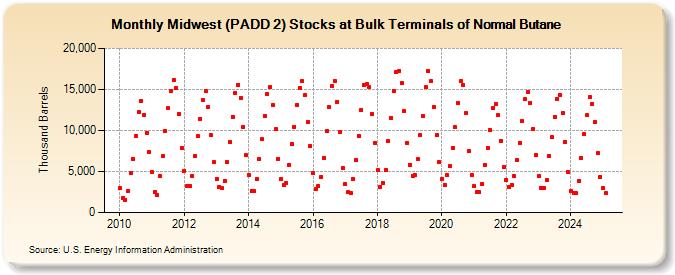
| Midwest (PADD 2) Stocks at Bulk Terminals of Normal Butane (Thousand Barrels) | ||||||||
| Year | Jan | Feb | Mar | Apr | May | Jun | Jul | Aug | Sep | Oct | Nov | Dec |
|---|---|---|---|---|---|---|---|---|---|---|---|---|
| 2009 | 2,849 | 1,591 | 1,520 | 2,983 | 4,977 | 7,451 | 10,206 | 12,855 | 12,817 | 10,558 | 7,810 | 5,333 |
| 2010 | 2,942 | 1,768 | 1,543 | 2,632 | 4,799 | 6,584 | 9,379 | 12,224 | 13,625 | 11,878 | 9,730 | 7,354 |
| 2011 | 4,896 | 2,471 | 2,163 | 4,403 | 6,851 | 9,961 | 12,694 | 14,860 | 16,156 | 15,143 | 12,004 | 7,896 |
| 2012 | 5,096 | 3,203 | 3,240 | 4,483 | 6,924 | 9,303 | 11,457 | 13,766 | 14,755 | 12,874 | 9,397 | 6,130 |
| 2013 | 4,121 | 3,173 | 2,956 | 3,901 | 6,125 | 8,596 | 11,674 | 14,626 | 15,599 | 13,995 | 10,460 | 6,959 |
| 2014 | 4,571 | 2,629 | 2,622 | 4,059 | 6,567 | 8,930 | 11,751 | 14,417 | 15,267 | 13,122 | 10,139 | 6,568 |
| 2015 | 4,123 | 3,382 | 3,611 | 5,794 | 8,375 | 10,471 | 13,145 | 15,160 | 15,972 | 14,269 | 11,058 | 8,118 |
| 2016 | 4,853 | 2,915 | 3,221 | 4,378 | 6,630 | 9,910 | 12,814 | 15,427 | 16,070 | 13,521 | 9,849 | 5,408 |
| 2017 | 3,443 | 2,472 | 2,426 | 4,032 | 6,344 | 9,364 | 12,539 | 15,593 | 15,657 | 15,254 | 12,056 | 8,490 |
| 2018 | 5,147 | 3,132 | 3,657 | 5,181 | 8,691 | 11,571 | 14,794 | 17,149 | 17,301 | 15,762 | 12,319 | 8,510 |
| 2019 | 5,825 | 4,511 | 4,563 | 6,469 | 9,472 | 11,735 | 15,260 | 17,228 | 15,976 | 12,869 | 9,476 | 6,113 |
| 2020 | 4,098 | 3,411 | 4,523 | 5,655 | 7,863 | 10,365 | 13,361 | 15,985 | 15,537 | 12,154 | 7,468 | 4,588 |
| 2021 | 3,199 | 2,473 | 2,466 | 3,524 | 5,764 | 7,869 | 10,116 | 12,754 | 13,168 | 11,844 | 8,778 | 5,534 |
| 2022 | 3,955 | 3,163 | 3,358 | 4,426 | 6,360 | 8,524 | 11,126 | 13,833 | 14,710 | 13,385 | 10,187 | 6,981 |
| 2023 | 4,436 | 2,984 | 2,986 | 3,976 | 6,868 | 9,228 | 11,671 | 13,856 | 14,363 | 12,123 | 8,593 | 4,962 |
| 2024 | 2,680 | |||||||||||
| - = No Data Reported; -- = Not Applicable; NA = Not Available; W = Withheld to avoid disclosure of individual company data. |
| Release Date: 3/29/2024 |
| Next Release Date: 4/30/2024 |