|
Download Data (XLS File) |
|
||||||||
|
||||||||
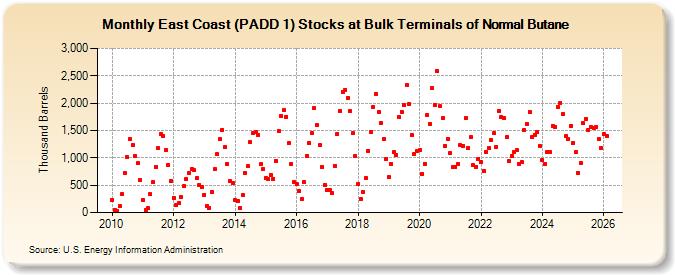
| East Coast (PADD 1) Stocks at Bulk Terminals of Normal Butane (Thousand Barrels) | ||||||||
| Year | Jan | Feb | Mar | Apr | May | Jun | Jul | Aug | Sep | Oct | Nov | Dec |
|---|---|---|---|---|---|---|---|---|---|---|---|---|
| 2009 | 420 | 328 | 266 | 413 | 692 | 1,115 | 1,413 | 1,706 | 1,536 | 1,199 | 904 | 439 |
| 2010 | 234 | 47 | 27 | 112 | 336 | 716 | 1,011 | 1,345 | 1,240 | 1,029 | 900 | 592 |
| 2011 | 237 | 49 | 76 | 333 | 550 | 838 | 1,173 | 1,437 | 1,392 | 1,139 | 870 | 575 |
| 2012 | 272 | 131 | 179 | 279 | 477 | 613 | 725 | 795 | 773 | 629 | 507 | 462 |
| 2013 | 330 | 122 | 89 | 384 | 790 | 1,063 | 1,340 | 1,511 | 1,193 | 889 | 572 | 538 |
| 2014 | 232 | 215 | 84 | 325 | 724 | 844 | 1,283 | 1,449 | 1,466 | 1,426 | 880 | 801 |
| 2015 | 637 | 610 | 686 | 618 | 947 | 1,492 | 1,767 | 1,867 | 1,754 | 1,268 | 896 | 553 |
| 2016 | 513 | 393 | 248 | 552 | 1,039 | 1,272 | 1,445 | 1,906 | 1,600 | 1,238 | 841 | 512 |
| 2017 | 415 | 411 | 356 | 859 | 1,444 | 1,855 | 2,204 | 2,240 | 2,101 | 1,847 | 1,447 | 1,032 |
| 2018 | 531 | 249 | 383 | 629 | 1,125 | 1,475 | 1,934 | 2,173 | 1,841 | 1,638 | 1,343 | 987 |
| 2019 | 641 | 883 | 1,105 | 1,059 | 1,745 | 1,844 | 1,959 | 2,328 | 1,979 | 1,418 | 1,079 | 1,123 |
| 2020 | 1,136 | 710 | 892 | 1,791 | 1,622 | 2,269 | 1,969 | 2,586 | 1,942 | 1,722 | 1,218 | 1,346 |
| 2021 | 1,080 | 826 | 838 | 892 | 1,229 | 1,218 | 1,732 | 1,188 | 1,375 | 860 | 836 | 985 |
| 2022 | 924 | 767 | 1,112 | 1,179 | 1,322 | 1,448 | 1,200 | 1,863 | 1,745 | 1,726 | 1,373 | 937 |
| 2023 | 1,042 | 1,106 | 1,037 | 895 | 916 | 1,513 | 1,469 | 1,837 | 1,371 | 1,411 | 1,465 | 1,172 |
| 2024 | 927 | |||||||||||
| - = No Data Reported; -- = Not Applicable; NA = Not Available; W = Withheld to avoid disclosure of individual company data. |
| Release Date: 3/29/2024 |
| Next Release Date: 4/30/2024 |