|
Download Data (XLS File) |
|
||||||||
|
||||||||
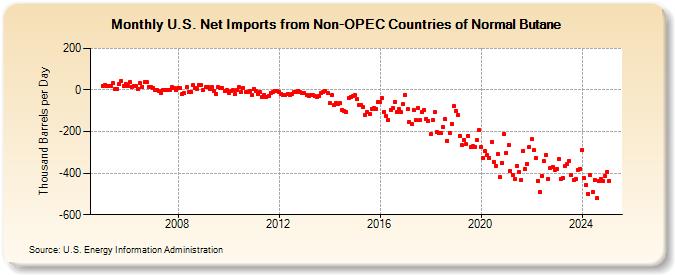
| U.S. Net Imports from Non-OPEC Countries of Normal Butane (Thousand Barrels per Day) | ||||||||
| Year | Jan | Feb | Mar | Apr | May | Jun | Jul | Aug | Sep | Oct | Nov | Dec |
|---|---|---|---|---|---|---|---|---|---|---|---|---|
| 2005 | 21 | 26 | 17 | 19 | 20 | 33 | 5 | 7 | 28 | 42 | 20 | 31 |
| 2006 | 18 | 37 | 15 | 21 | 17 | 5 | 32 | 16 | 38 | 36 | 16 | 12 |
| 2007 | 9 | 1 | 2 | -6 | -15 | 0 | 1 | 1 | 1 | 12 | 8 | -1 |
| 2008 | 9 | 8 | -18 | -16 | 12 | -11 | -11 | 22 | 11 | 5 | 22 | 22 |
| 2009 | 1 | 13 | 14 | 7 | 13 | -6 | -18 | 13 | 8 | 9 | -3 | -2 |
| 2010 | -14 | -7 | -2 | -21 | -1 | 13 | -9 | 9 | -9 | -10 | -5 | -23 |
| 2011 | 6 | -7 | -17 | -11 | -36 | -23 | -36 | -29 | -13 | -11 | -3 | -5 |
| 2012 | -8 | -19 | -26 | -24 | -19 | -22 | -17 | -12 | -9 | -3 | -11 | -13 |
| 2013 | -15 | -23 | -27 | -22 | -26 | -28 | -33 | -31 | -14 | -9 | -4 | -15 |
| 2014 | -64 | -23 | -74 | -62 | -69 | -65 | -95 | -100 | -105 | -39 | -34 | -31 |
| 2015 | -25 | -45 | -72 | -70 | -82 | -118 | -106 | -116 | -90 | -86 | -92 | -60 |
| 2016 | -59 | -41 | -107 | -126 | -145 | -94 | -87 | -58 | -107 | -93 | -108 | -69 |
| 2017 | -23 | -93 | -155 | -166 | -97 | -146 | -87 | -145 | -106 | -96 | -138 | -148 |
| 2018 | -214 | -145 | -108 | -202 | -209 | -206 | -178 | -141 | -244 | -205 | -166 | -78 |
| 2019 | -101 | -121 | -221 | -266 | -240 | -260 | -220 | -276 | -271 | -275 | -241 | -193 |
| 2020 | -276 | -325 | -295 | -315 | -325 | -249 | -346 | -364 | -309 | -419 | -349 | -213 |
| 2021 | -304 | -264 | -392 | -407 | -429 | -366 | -394 | -435 | -293 | -379 | -355 | -275 |
| 2022 | -238 | -290 | -326 | -438 | -490 | -413 | -343 | -315 | -427 | -373 | -370 | -384 |
| 2023 | -404 | -415 | -420 | -478 | -363 | -399 | -351 | -433 | -477 | -429 | -382 | -377 |
| 2024 | -288 | |||||||||||
| - = No Data Reported; -- = Not Applicable; NA = Not Available; W = Withheld to avoid disclosure of individual company data. |
| Release Date: 3/29/2024 |
| Next Release Date: 4/30/2024 |