|
Download Data (XLS File) |
|
||||||||
|
||||||||
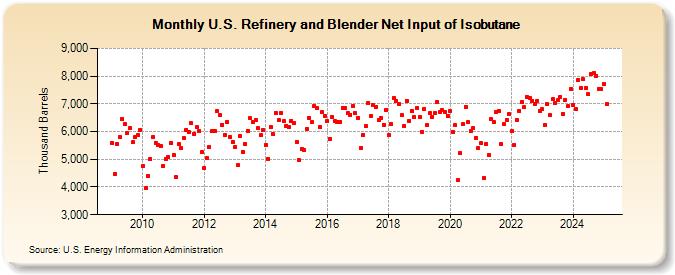
| U.S. Refinery and Blender Net Input of Isobutane (Thousand Barrels) | ||||||||
| Year | Jan | Feb | Mar | Apr | May | Jun | Jul | Aug | Sep | Oct | Nov | Dec |
|---|---|---|---|---|---|---|---|---|---|---|---|---|
| 2009 | 5,592 | 4,470 | 5,566 | 5,819 | 6,465 | 6,265 | 5,963 | 6,119 | 5,608 | 5,804 | 5,858 | 6,056 |
| 2010 | 4,770 | 3,971 | 4,414 | 5,009 | 5,804 | 5,596 | 5,522 | 5,466 | 4,756 | 5,024 | 5,077 | 5,582 |
| 2011 | 5,146 | 4,351 | 5,540 | 5,424 | 5,774 | 6,071 | 5,974 | 6,296 | 5,929 | 6,149 | 6,029 | 5,245 |
| 2012 | 4,688 | 5,033 | 5,443 | 6,006 | 6,027 | 6,725 | 6,586 | 6,248 | 5,887 | 6,361 | 5,808 | 5,616 |
| 2013 | 5,451 | 4,784 | 5,846 | 5,256 | 5,542 | 6,021 | 6,479 | 6,345 | 6,417 | 6,116 | 5,872 | 6,065 |
| 2014 | 5,517 | 5,018 | 6,170 | 5,902 | 6,676 | 6,407 | 6,687 | 6,374 | 6,217 | 6,157 | 6,393 | 6,307 |
| 2015 | 5,640 | 4,963 | 5,385 | 5,329 | 6,102 | 6,483 | 6,342 | 6,919 | 6,861 | 6,151 | 6,700 | 6,569 |
| 2016 | 6,375 | 5,741 | 6,532 | 6,380 | 6,345 | 6,355 | 6,863 | 6,862 | 6,660 | 6,607 | 6,930 | 6,660 |
| 2017 | 6,505 | 5,405 | 5,880 | 6,196 | 7,034 | 6,559 | 6,944 | 6,889 | 6,401 | 6,500 | 6,253 | 6,794 |
| 2018 | 5,862 | 6,258 | 7,213 | 7,101 | 7,006 | 6,583 | 6,212 | 7,120 | 6,397 | 6,755 | 6,514 | 6,846 |
| 2019 | 6,528 | 5,998 | 6,815 | 6,233 | 6,658 | 6,543 | 6,666 | 7,062 | 6,718 | 6,768 | 6,698 | 6,574 |
| 2020 | 6,727 | 5,997 | 6,225 | 4,236 | 5,231 | 6,263 | 6,899 | 6,335 | 6,016 | 6,124 | 5,785 | 5,411 |
| 2021 | 5,573 | 4,323 | 5,561 | 5,153 | 6,443 | 6,329 | 6,707 | 6,756 | 5,535 | 6,262 | 6,409 | 6,620 |
| 2022 | 6,013 | 5,523 | 6,427 | 6,746 | 7,075 | 6,868 | 7,263 | 7,221 | 7,114 | 6,998 | 7,119 | 6,751 |
| 2023 | 6,801 | 6,221 | 6,984 | 6,590 | 7,164 | 7,029 | 7,123 | 7,249 | 6,631 | 7,151 | 6,914 | 7,553 |
| 2024 | 6,973 | |||||||||||
| - = No Data Reported; -- = Not Applicable; NA = Not Available; W = Withheld to avoid disclosure of individual company data. |
| Release Date: 3/29/2024 |
| Next Release Date: 4/30/2024 |