|
Download Data (XLS File) |
|
||||||||
|
||||||||
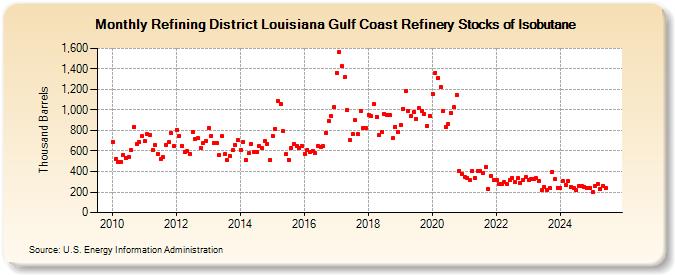
| Refining District Louisiana Gulf Coast Refinery Stocks of Isobutane (Thousand Barrels) | ||||||||
| Year | Jan | Feb | Mar | Apr | May | Jun | Jul | Aug | Sep | Oct | Nov | Dec |
|---|---|---|---|---|---|---|---|---|---|---|---|---|
| 2010 | 691 | 521 | 494 | 496 | 561 | 531 | 541 | 605 | 835 | 669 | 688 | 748 |
| 2011 | 693 | 763 | 759 | 610 | 657 | 574 | 526 | 538 | 663 | 684 | 775 | 650 |
| 2012 | 809 | 751 | 652 | 590 | 602 | 575 | 781 | 715 | 722 | 628 | 679 | 702 |
| 2013 | 828 | 747 | 678 | 680 | 560 | 747 | 566 | 509 | 548 | 608 | 660 | 704 |
| 2014 | 613 | 689 | 511 | 576 | 671 | 595 | 595 | 645 | 626 | 694 | 673 | 516 |
| 2015 | 749 | 819 | 1,092 | 1,062 | 792 | 566 | 516 | 628 | 673 | 652 | 627 | 653 |
| 2016 | 573 | 611 | 589 | 603 | 581 | 647 | 637 | 646 | 778 | 895 | 940 | 1,026 |
| 2017 | 1,365 | 1,567 | 1,425 | 1,320 | 1,000 | 703 | 763 | 902 | 761 | 993 | 824 | 823 |
| 2018 | 954 | 937 | 1,054 | 933 | 758 | 787 | 962 | 954 | 948 | 722 | 837 | 789 |
| 2019 | 855 | 1,012 | 1,184 | 993 | 945 | 978 | 914 | 1,018 | 987 | 962 | 844 | 944 |
| 2020 | 1,160 | 1,363 | 1,311 | 1,225 | 994 | 836 | 863 | 971 | 1,025 | 1,146 | 408 | 375 |
| 2021 | 350 | 337 | 316 | 404 | 339 | 408 | 407 | 390 | 445 | 232 | 356 | 315 |
| 2022 | 322 | 280 | 281 | 299 | 280 | 319 | 337 | 299 | 332 | 291 | 322 | 342 |
| 2023 | 320 | 323 | 331 | 333 | 307 | 215 | 253 | 222 | 242 | 396 | 325 | 243 |
| 2024 | 244 | |||||||||||
| - = No Data Reported; -- = Not Applicable; NA = Not Available; W = Withheld to avoid disclosure of individual company data. |
| Release Date: 3/29/2024 |
| Next Release Date: 4/30/2024 |
Referring Pages: