|
Download Data (XLS File) |
|
||||||||
|
||||||||
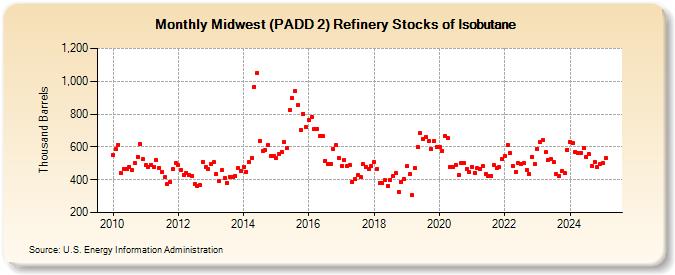
| Midwest (PADD 2) Refinery Stocks of Isobutane (Thousand Barrels) | ||||||||
| Year | Jan | Feb | Mar | Apr | May | Jun | Jul | Aug | Sep | Oct | Nov | Dec |
|---|---|---|---|---|---|---|---|---|---|---|---|---|
| 2010 | 548 | 588 | 614 | 438 | 467 | 465 | 478 | 459 | 503 | 540 | 619 | 524 |
| 2011 | 487 | 476 | 491 | 479 | 520 | 474 | 449 | 416 | 373 | 388 | 463 | 504 |
| 2012 | 489 | 460 | 430 | 444 | 429 | 422 | 374 | 360 | 365 | 509 | 480 | 466 |
| 2013 | 494 | 506 | 436 | 392 | 457 | 411 | 380 | 418 | 416 | 424 | 471 | 454 |
| 2014 | 477 | 450 | 506 | 532 | 967 | 1,053 | 636 | 574 | 581 | 611 | 544 | 545 |
| 2015 | 532 | 554 | 569 | 631 | 594 | 827 | 897 | 938 | 854 | 702 | 803 | 722 |
| 2016 | 765 | 783 | 709 | 711 | 665 | 669 | 517 | 494 | 496 | 588 | 612 | 534 |
| 2017 | 486 | 520 | 482 | 489 | 384 | 404 | 427 | 414 | 494 | 477 | 463 | 485 |
| 2018 | 509 | 466 | 378 | 379 | 398 | 364 | 400 | 420 | 440 | 327 | 389 | 402 |
| 2019 | 482 | 433 | 306 | 472 | 600 | 682 | 648 | 659 | 637 | 588 | 637 | 597 |
| 2020 | 601 | 574 | 664 | 652 | 480 | 476 | 489 | 428 | 502 | 502 | 467 | 445 |
| 2021 | 479 | 441 | 469 | 465 | 483 | 436 | 424 | 423 | 488 | 472 | 476 | 526 |
| 2022 | 547 | 613 | 564 | 486 | 450 | 500 | 493 | 502 | 458 | 437 | 541 | 494 |
| 2023 | 588 | 630 | 641 | 568 | 523 | 525 | 506 | 432 | 424 | 451 | 442 | 584 |
| 2024 | 630 | 621 | 571 | 560 | 565 | 593 | 540 | 556 | 485 | 508 | 477 | 495 |
| 2025 | 501 | 532 | 549 | 525 | ||||||||
| - = No Data Reported; -- = Not Applicable; NA = Not Available; W = Withheld to avoid disclosure of individual company data. |
| Release Date: 6/30/2025 |
| Next Release Date: 7/31/2025 |