|
Download Data (XLS File) |
|
||||||||
|
||||||||
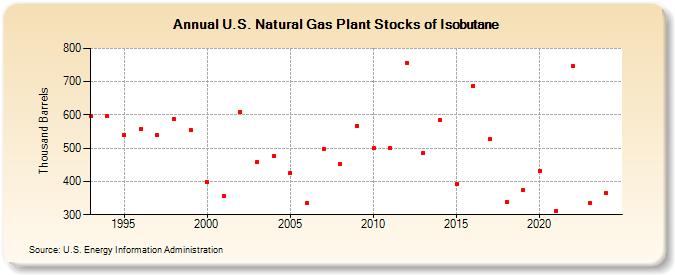
| U.S. Natural Gas Plant Stocks of Isobutane (Thousand Barrels) | ||||||||
| Decade | Year-0 | Year-1 | Year-2 | Year-3 | Year-4 | Year-5 | Year-6 | Year-7 | Year-8 | Year-9 |
|---|---|---|---|---|---|---|---|---|---|---|
| 1990's | 596 | 596 | 541 | 558 | 539 | 587 | 554 | |||
| 2000's | 397 | 356 | 609 | 458 | 476 | 426 | 336 | 499 | 453 | 567 |
| 2010's | 500 | 500 | 757 | 487 | 585 | 392 | 688 | 527 | 339 | 373 |
| 2020's | 432 | 312 | 746 | 336 |
| - = No Data Reported; -- = Not Applicable; NA = Not Available; W = Withheld to avoid disclosure of individual company data. |
| Release Date: 8/30/2024 |
| Next Release Date: 8/29/2025 |