|
Download Data (XLS File) |
|
||||||||
|
||||||||
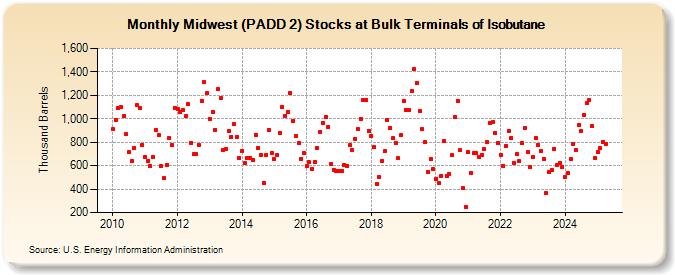
| Midwest (PADD 2) Stocks at Bulk Terminals of Isobutane (Thousand Barrels) | ||||||||
| Year | Jan | Feb | Mar | Apr | May | Jun | Jul | Aug | Sep | Oct | Nov | Dec |
|---|---|---|---|---|---|---|---|---|---|---|---|---|
| 2010 | 911 | 992 | 1,088 | 1,097 | 1,022 | 869 | 713 | 636 | 753 | 1,117 | 1,095 | 779 |
| 2011 | 672 | 643 | 595 | 673 | 905 | 859 | 593 | 491 | 603 | 837 | 776 | 1,095 |
| 2012 | 1,081 | 1,056 | 1,074 | 1,020 | 1,123 | 795 | 696 | 700 | 779 | 1,153 | 1,315 | 1,216 |
| 2013 | 1,002 | 1,058 | 908 | 1,250 | 1,176 | 736 | 741 | 893 | 847 | 952 | 845 | 664 |
| 2014 | 726 | 622 | 662 | 667 | 645 | 862 | 751 | 691 | 456 | 691 | 906 | 710 |
| 2015 | 653 | 694 | 881 | 1,101 | 1,025 | 1,056 | 1,219 | 985 | 851 | 796 | 660 | 707 |
| 2016 | 594 | 628 | 572 | 632 | 752 | 891 | 968 | 1,017 | 930 | 616 | 566 | 556 |
| 2017 | 551 | 552 | 606 | 601 | 774 | 732 | 828 | 909 | 1,002 | 1,156 | 1,161 | 898 |
| 2018 | 853 | 759 | 446 | 504 | 639 | 721 | 992 | 922 | 833 | 795 | 663 | 858 |
| 2019 | 1,152 | 1,077 | 1,073 | 1,235 | 1,420 | 1,305 | 1,062 | 912 | 798 | 549 | 658 | 573 |
| 2020 | 485 | 451 | 514 | 811 | 516 | 530 | 688 | 1,013 | 1,150 | 731 | 406 | 248 |
| 2021 | 714 | 537 | 708 | 704 | 676 | 694 | 740 | 801 | 967 | 970 | 882 | 796 |
| 2022 | 691 | 601 | 770 | 897 | 837 | 623 | 700 | 637 | 791 | 923 | 716 | 586 |
| 2023 | 672 | 838 | 777 | 726 | 660 | 366 | 547 | 566 | 746 | 602 | 620 | 592 |
| 2024 | 505 | |||||||||||
| - = No Data Reported; -- = Not Applicable; NA = Not Available; W = Withheld to avoid disclosure of individual company data. |
| Release Date: 3/29/2024 |
| Next Release Date: 4/30/2024 |