|
Download Data (XLS File) |
|
||||||||
|
||||||||
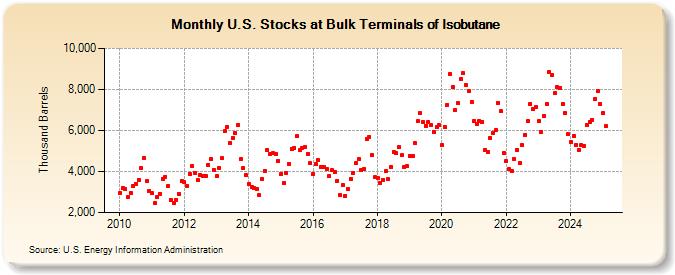
| U.S. Stocks at Bulk Terminals of Isobutane (Thousand Barrels) | ||||||||
| Year | Jan | Feb | Mar | Apr | May | Jun | Jul | Aug | Sep | Oct | Nov | Dec |
|---|---|---|---|---|---|---|---|---|---|---|---|---|
| 2010 | 2,933 | 3,197 | 3,141 | 2,750 | 2,962 | 3,290 | 3,405 | 3,589 | 4,174 | 4,682 | 3,529 | 3,061 |
| 2011 | 2,932 | 2,454 | 2,750 | 2,925 | 3,643 | 3,745 | 3,306 | 2,604 | 2,451 | 2,632 | 2,912 | 3,515 |
| 2012 | 3,475 | 3,294 | 3,894 | 4,259 | 3,909 | 3,581 | 3,852 | 3,796 | 3,763 | 4,341 | 4,605 | 4,082 |
| 2013 | 3,760 | 4,173 | 4,636 | 5,957 | 6,187 | 5,398 | 5,634 | 5,873 | 6,269 | 4,603 | 4,174 | 3,807 |
| 2014 | 3,398 | 3,252 | 3,190 | 3,139 | 2,845 | 3,637 | 4,042 | 5,039 | 4,878 | 4,886 | 4,872 | 4,518 |
| 2015 | 3,856 | 3,433 | 3,921 | 4,369 | 5,086 | 5,164 | 5,710 | 5,045 | 5,138 | 5,216 | 4,868 | 4,398 |
| 2016 | 3,880 | 4,350 | 4,540 | 4,237 | 4,244 | 4,128 | 3,793 | 4,059 | 3,978 | 3,552 | 2,856 | 3,338 |
| 2017 | 2,823 | 3,171 | 3,641 | 3,952 | 4,425 | 4,622 | 4,053 | 4,130 | 5,598 | 5,684 | 4,794 | 3,714 |
| 2018 | 3,684 | 3,419 | 3,606 | 4,012 | 3,617 | 4,230 | 4,956 | 4,885 | 5,177 | 4,790 | 4,214 | 4,252 |
| 2019 | 4,771 | 4,754 | 5,375 | 6,444 | 6,852 | 6,423 | 6,235 | 6,416 | 6,266 | 5,939 | 6,166 | 6,251 |
| 2020 | 5,284 | 6,189 | 7,247 | 8,753 | 8,099 | 6,992 | 7,337 | 8,526 | 8,784 | 8,218 | 7,940 | 7,390 |
| 2021 | 6,469 | 6,302 | 6,463 | 6,436 | 5,057 | 4,964 | 5,647 | 5,885 | 6,001 | 7,354 | 6,928 | 4,908 |
| 2022 | 4,489 | 4,099 | 4,018 | 4,617 | 5,039 | 4,395 | 5,275 | 5,801 | 6,443 | 7,307 | 7,023 | 7,130 |
| 2023 | 6,438 | 5,932 | 6,717 | 7,298 | 8,841 | 8,702 | 7,825 | 8,101 | 8,068 | 7,291 | 6,838 | 5,805 |
| 2024 | 5,445 | |||||||||||
| - = No Data Reported; -- = Not Applicable; NA = Not Available; W = Withheld to avoid disclosure of individual company data. |
| Release Date: 3/29/2024 |
| Next Release Date: 4/30/2024 |