|
Download Data (XLS File) |
|
||||||||
|
||||||||
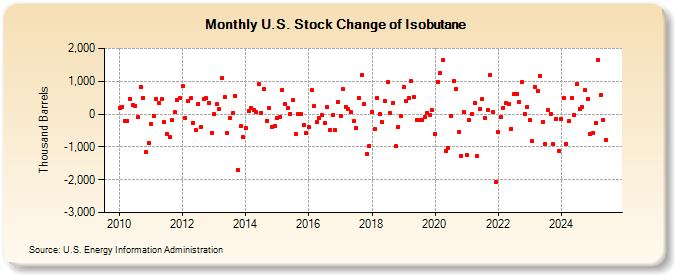
| U.S. Stock Change of Isobutane (Thousand Barrels) | ||||||||
| Year | Jan | Feb | Mar | Apr | May | Jun | Jul | Aug | Sep | Oct | Nov | Dec |
|---|---|---|---|---|---|---|---|---|---|---|---|---|
| 2010 | 187 | 217 | -223 | -204 | 471 | 267 | 254 | -87 | 826 | 499 | -1,153 | -878 |
| 2011 | -299 | -60 | 468 | 326 | 444 | -235 | -605 | -706 | -196 | 48 | 438 | 488 |
| 2012 | 846 | -120 | 402 | 474 | -261 | -492 | 318 | -400 | 468 | 477 | 342 | -571 |
| 2013 | -5 | 296 | 146 | 1,098 | 529 | -581 | -107 | 31 | 563 | -1,700 | -375 | -692 |
| 2014 | -438 | 100 | 186 | 134 | 51 | 902 | 27 | 753 | -200 | 175 | -383 | -361 |
| 2015 | -122 | -79 | 727 | 298 | 180 | 12 | 418 | -610 | -4 | -1 | -319 | -584 |
| 2016 | -390 | 719 | 233 | -252 | -124 | -33 | -270 | 207 | -472 | -30 | -486 | 371 |
| 2017 | -59 | 753 | 226 | 148 | 53 | -222 | -423 | 499 | 1,178 | 316 | -1,213 | -964 |
| 2018 | 75 | -463 | 502 | -2 | -253 | 385 | 963 | 32 | 338 | -980 | -392 | -66 |
| 2019 | 814 | 387 | 475 | 1,009 | 523 | -170 | -194 | -187 | -100 | 34 | -22 | 111 |
| 2020 | -599 | 984 | 1,257 | 1,653 | -1,127 | -1,020 | -72 | 998 | 778 | -540 | -1,274 | 51 |
| 2021 | -1,254 | -188 | -2 | 331 | -1,290 | 144 | 452 | -109 | 130 | 1,186 | 49 | -2,081 |
| 2022 | -547 | -103 | 196 | 337 | 299 | -449 | 602 | 603 | 380 | 971 | 4 | 226 |
| 2023 | -178 | -823 | 845 | 666 | 1,165 | -210 | -902 | 95 | 108 | -1,009 | -137 | -1,123 |
| 2024 | -152 | |||||||||||
| - = No Data Reported; -- = Not Applicable; NA = Not Available; W = Withheld to avoid disclosure of individual company data. |
| Release Date: 3/29/2024 |
| Next Release Date: 4/30/2024 |
Referring Pages: