|
Download Data (XLS File) |
|
||||||||
|
||||||||
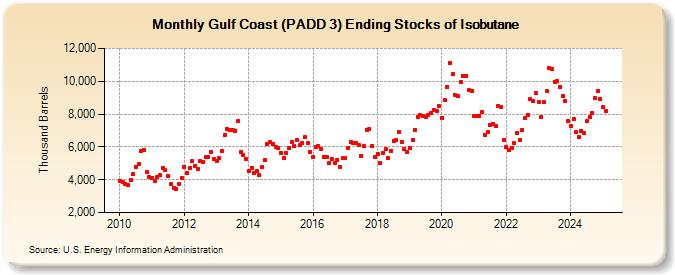
| Gulf Coast (PADD 3) Ending Stocks of Isobutane (Thousand Barrels) | ||||||||
| Year | Jan | Feb | Mar | Apr | May | Jun | Jul | Aug | Sep | Oct | Nov | Dec |
|---|---|---|---|---|---|---|---|---|---|---|---|---|
| 2010 | 3,929 | 3,844 | 3,745 | 3,655 | 3,979 | 4,350 | 4,784 | 4,947 | 5,772 | 5,782 | 4,441 | 4,136 |
| 2011 | 4,114 | 3,926 | 4,162 | 4,260 | 4,723 | 4,575 | 4,244 | 3,762 | 3,517 | 3,438 | 3,755 | 4,094 |
| 2012 | 4,802 | 4,421 | 4,699 | 5,118 | 4,841 | 4,629 | 5,132 | 5,095 | 5,404 | 5,365 | 5,701 | 5,236 |
| 2013 | 5,125 | 5,314 | 5,778 | 6,729 | 7,091 | 7,036 | 7,057 | 6,995 | 7,572 | 5,694 | 5,492 | 5,280 |
| 2014 | 4,548 | 4,721 | 4,400 | 4,530 | 4,285 | 4,791 | 5,175 | 6,204 | 6,308 | 6,191 | 6,008 | 5,913 |
| 2015 | 5,633 | 5,308 | 5,646 | 5,924 | 6,301 | 6,066 | 6,438 | 6,104 | 6,247 | 6,597 | 6,243 | 5,703 |
| 2016 | 5,371 | 6,002 | 6,062 | 5,856 | 5,363 | 5,412 | 5,035 | 5,287 | 4,995 | 5,212 | 4,757 | 5,340 |
| 2017 | 5,299 | 5,959 | 6,294 | 6,234 | 6,259 | 6,089 | 5,443 | 6,037 | 7,031 | 7,085 | 6,027 | 5,371 |
| 2018 | 5,584 | 5,031 | 5,646 | 5,845 | 5,310 | 5,740 | 6,355 | 6,450 | 6,899 | 6,309 | 5,845 | 5,711 |
| 2019 | 5,958 | 6,442 | 7,044 | 7,834 | 7,935 | 7,889 | 7,849 | 7,967 | 8,063 | 8,273 | 8,177 | 8,479 |
| 2020 | 7,776 | 8,858 | 9,667 | 11,114 | 10,420 | 9,151 | 9,098 | 9,949 | 10,344 | 10,310 | 9,440 | 9,425 |
| 2021 | 7,907 | 7,875 | 7,908 | 8,110 | 6,736 | 6,931 | 7,357 | 7,424 | 7,283 | 8,489 | 8,423 | 6,414 |
| 2022 | 5,986 | 5,838 | 5,906 | 6,218 | 6,821 | 6,410 | 7,033 | 7,768 | 7,937 | 8,888 | 8,769 | 9,311 |
| 2023 | 8,722 | 7,823 | 8,720 | 9,407 | 10,812 | 10,777 | 9,993 | 10,012 | 9,767 | 9,079 | 8,798 | 7,562 |
| 2024 | 7,262 | |||||||||||
| - = No Data Reported; -- = Not Applicable; NA = Not Available; W = Withheld to avoid disclosure of individual company data. |
| Release Date: 3/29/2024 |
| Next Release Date: 4/30/2024 |