|
Download Data (XLS File) |
|
||||||||
|
||||||||
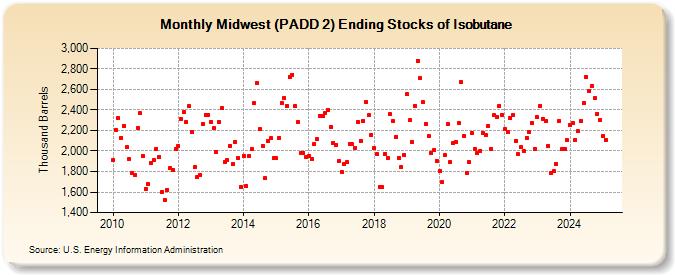
| Midwest (PADD 2) Ending Stocks of Isobutane (Thousand Barrels) | ||||||||
| Year | Jan | Feb | Mar | Apr | May | Jun | Jul | Aug | Sep | Oct | Nov | Dec |
|---|---|---|---|---|---|---|---|---|---|---|---|---|
| 2010 | 1,911 | 2,207 | 2,319 | 2,130 | 2,242 | 2,036 | 1,921 | 1,789 | 1,767 | 2,225 | 2,367 | 1,950 |
| 2011 | 1,632 | 1,678 | 1,883 | 1,916 | 2,020 | 1,943 | 1,601 | 1,525 | 1,620 | 1,835 | 1,819 | 2,022 |
| 2012 | 2,051 | 2,314 | 2,379 | 2,283 | 2,437 | 2,181 | 1,840 | 1,749 | 1,768 | 2,261 | 2,350 | 2,353 |
| 2013 | 2,278 | 2,221 | 1,993 | 2,284 | 2,415 | 1,895 | 1,909 | 2,053 | 1,872 | 2,087 | 1,934 | 1,651 |
| 2014 | 1,956 | 1,658 | 1,955 | 2,020 | 2,463 | 2,660 | 2,211 | 2,053 | 1,734 | 2,102 | 2,122 | 1,931 |
| 2015 | 1,934 | 2,129 | 2,466 | 2,516 | 2,443 | 2,717 | 2,744 | 2,436 | 2,282 | 1,979 | 1,985 | 1,940 |
| 2016 | 1,953 | 1,922 | 2,064 | 2,114 | 2,343 | 2,344 | 2,369 | 2,401 | 2,238 | 2,082 | 2,061 | 1,902 |
| 2017 | 1,795 | 1,876 | 1,889 | 2,068 | 2,065 | 2,032 | 2,287 | 2,099 | 2,297 | 2,478 | 2,347 | 2,160 |
| 2018 | 2,029 | 1,968 | 1,652 | 1,646 | 1,975 | 1,931 | 2,356 | 2,290 | 2,139 | 1,935 | 1,842 | 1,961 |
| 2019 | 2,553 | 2,298 | 2,087 | 2,443 | 2,880 | 2,708 | 2,475 | 2,266 | 2,145 | 1,979 | 2,009 | 1,907 |
| 2020 | 1,805 | 1,695 | 1,960 | 2,262 | 1,888 | 2,074 | 2,092 | 2,274 | 2,668 | 2,147 | 1,790 | 1,889 |
| 2021 | 2,173 | 2,019 | 1,977 | 2,000 | 2,176 | 2,156 | 2,246 | 2,022 | 2,346 | 2,329 | 2,441 | 2,352 |
| 2022 | 2,213 | 2,183 | 2,317 | 2,352 | 2,101 | 1,967 | 2,035 | 1,996 | 2,131 | 2,181 | 2,273 | 2,021 |
| 2023 | 2,335 | 2,449 | 2,323 | 2,284 | 2,046 | 1,784 | 1,801 | 1,875 | 2,296 | 2,015 | 2,023 | 2,104 |
| 2024 | 2,255 | |||||||||||
| - = No Data Reported; -- = Not Applicable; NA = Not Available; W = Withheld to avoid disclosure of individual company data. |
| Release Date: 3/29/2024 |
| Next Release Date: 4/30/2024 |