|
Download Data (XLS File) |
|
||||||||
|
||||||||
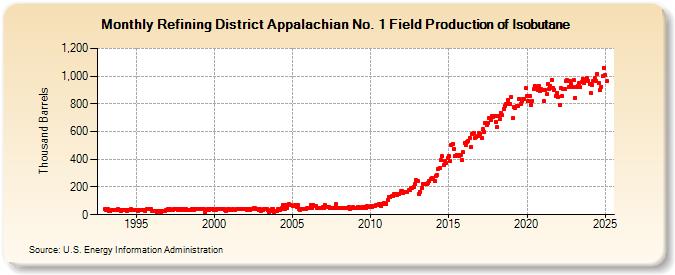
| Refining District Appalachian No. 1 Field Production of Isobutane (Thousand Barrels) | ||||||||
| Year | Jan | Feb | Mar | Apr | May | Jun | Jul | Aug | Sep | Oct | Nov | Dec |
|---|---|---|---|---|---|---|---|---|---|---|---|---|
| 1993 | 38 | 37 | 38 | 30 | 25 | 35 | 32 | 34 | 34 | 37 | 39 | 36 |
| 1994 | 30 | 35 | 36 | 34 | 31 | 28 | 35 | 33 | 38 | 37 | 37 | 35 |
| 1995 | 37 | 30 | 37 | 34 | 32 | 36 | 33 | 27 | 40 | 40 | 38 | 38 |
| 1996 | 30 | 26 | 30 | 29 | 22 | 26 | 29 | 16 | 28 | 29 | 29 | 32 |
| 1997 | 38 | 32 | 39 | 34 | 36 | 38 | 40 | 41 | 32 | 39 | 35 | 38 |
| 1998 | 38 | 35 | 40 | 35 | 33 | 37 | 33 | 41 | 36 | 39 | 42 | 44 |
| 1999 | 42 | 43 | 43 | 41 | 39 | 23 | 36 | 39 | 37 | 41 | 41 | 44 |
| 2000 | 36 | 36 | 43 | 40 | 38 | 40 | 43 | 40 | 33 | 26 | 41 | 42 |
| 2001 | 35 | 34 | 40 | 37 | 37 | 41 | 43 | 42 | 40 | 41 | 40 | 40 |
| 2002 | 40 | 37 | 39 | 35 | 42 | 40 | 45 | 46 | 42 | 43 | 32 | 39 |
| 2003 | 29 | 32 | 38 | 38 | 43 | 31 | 20 | 25 | 42 | 44 | 23 | 25 |
| 2004 | 28 | 38 | 31 | 44 | 48 | 70 | 40 | 73 | 47 | 77 | 71 | 70 |
| 2005 | 65 | 61 | 67 | 58 | 69 | 44 | 37 | 44 | 42 | 44 | 44 | 45 |
| 2006 | 49 | 52 | 72 | 52 | 72 | 64 | 65 | 51 | 52 | 47 | 52 | 53 |
| 2007 | 52 | 70 | 56 | 57 | 59 | 51 | 52 | 48 | 49 | 74 | 49 | 50 |
| 2008 | 49 | 47 | 49 | 46 | 50 | 47 | 52 | 53 | 40 | 52 | 53 | 50 |
| 2009 | 50 | 45 | 53 | 53 | 51 | 52 | 55 | 56 | 51 | 60 | 57 | 55 |
| 2010 | 60 | 56 | 66 | 61 | 67 | 68 | 74 | 72 | 61 | 75 | 84 | 79 |
| 2011 | 78 | 104 | 126 | 129 | 134 | 132 | 149 | 147 | 143 | 148 | 150 | 169 |
| 2012 | 174 | 157 | 166 | 163 | 167 | 175 | 177 | 192 | 193 | 200 | 220 | 248 |
| 2013 | 242 | 150 | 166 | 193 | 220 | 223 | 218 | 223 | 232 | 240 | 256 | 266 |
| 2014 | 260 | 245 | 282 | 289 | 332 | 339 | 393 | 421 | 359 | 391 | 376 | 407 |
| 2015 | 427 | 386 | 500 | 511 | 477 | 421 | 433 | 433 | 422 | 429 | 396 | 452 |
| 2016 | 521 | 500 | 527 | 534 | 553 | 487 | 580 | 593 | 557 | 558 | 565 | 588 |
| 2017 | 582 | 553 | 617 | 597 | 660 | 647 | 662 | 700 | 680 | 715 | 704 | 713 |
| 2018 | 671 | 631 | 710 | 690 | 736 | 719 | 760 | 786 | 797 | 828 | 801 | 799 |
| 2019 | 851 | 697 | 774 | 771 | 783 | 784 | 833 | 801 | 820 | 837 | 838 | 911 |
| 2020 | 858 | 821 | 853 | 795 | 819 | 906 | 929 | 925 | 898 | 932 | 893 | 908 |
| 2021 | 902 | 818 | 901 | 869 | 945 | 906 | 932 | 975 | 917 | 900 | 860 | 880 |
| 2022 | 851 | 791 | 912 | 855 | 906 | 908 | 963 | 970 | 925 | 964 | 942 | 924 |
| 2023 | 971 | 848 | 927 | 935 | 953 | 919 | 957 | 980 | 947 | 971 | 984 | 967 |
| 2024 | 946 | |||||||||||
| - = No Data Reported; -- = Not Applicable; NA = Not Available; W = Withheld to avoid disclosure of individual company data. |
| Release Date: 3/29/2024 |
| Next Release Date: 4/30/2024 |