|
Download Data (XLS File) |
|
||||||||
|
||||||||
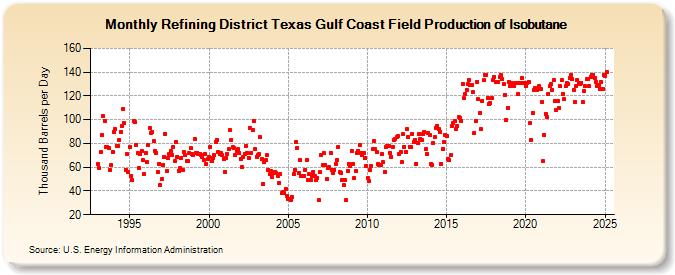
| Refining District Texas Gulf Coast Field Production of Isobutane (Thousand Barrels per Day) | ||||||||
| Year | Jan | Feb | Mar | Apr | May | Jun | Jul | Aug | Sep | Oct | Nov | Dec |
|---|---|---|---|---|---|---|---|---|---|---|---|---|
| 1993 | 63 | 59 | 73 | 87 | 103 | 99 | 77 | 77 | 76 | 58 | 62 | 73 |
| 1994 | 90 | 92 | 78 | 78 | 83 | 90 | 95 | 109 | 97 | 58 | 71 | 56 |
| 1995 | 77 | 53 | 49 | 99 | 98 | 79 | 72 | 59 | 71 | 74 | 66 | 54 |
| 1996 | 72 | 64 | 79 | 93 | 89 | 90 | 82 | 74 | 72 | 56 | 63 | 45 |
| 1997 | 50 | 62 | 69 | 88 | 57 | 68 | 71 | 74 | 70 | 77 | 65 | 81 |
| 1998 | 69 | 57 | 59 | 68 | 58 | 73 | 70 | 65 | 65 | 72 | 76 | 71 |
| 1999 | 70 | 84 | 72 | 72 | 71 | 71 | 70 | 69 | 66 | 71 | 63 | 67 |
| 2000 | 69 | 77 | 65 | 68 | 70 | 81 | 83 | 73 | 71 | 72 | 70 | 67 |
| 2001 | 56 | 68 | 71 | 75 | 91 | 83 | 77 | 76 | 70 | 74 | 75 | 72 |
| 2002 | 67 | 60 | 69 | 71 | 78 | 72 | 68 | 93 | 72 | 91 | 99 | 75 |
| 2003 | 69 | 70 | 71 | 85 | 67 | 46 | 64 | 66 | 70 | 58 | 54 | 57 |
| 2004 | 52 | 55 | 56 | 55 | 53 | 47 | 54 | 38 | 39 | 38 | 42 | 36 |
| 2005 | 33 | 33 | 32 | 35 | 54 | 58 | 81 | 76 | 55 | 66 | 53 | 53 |
| 2006 | 53 | 58 | 66 | 49 | 54 | 49 | 53 | 56 | 53 | 49 | 51 | 32 |
| 2007 | 56 | 70 | 62 | 72 | 62 | 50 | 59 | 60 | 72 | 58 | 55 | 58 |
| 2008 | 63 | 66 | 77 | 56 | 55 | 49 | 45 | 49 | 32 | 57 | 63 | 61 |
| 2009 | 74 | 63 | 51 | 57 | 72 | 74 | 79 | 72 | 70 | 72 | 68 | 61 |
| 2010 | 51 | 48 | 58 | 61 | 75 | 82 | 75 | 73 | 63 | 62 | 62 | 71 |
| 2011 | 64 | 56 | 77 | 78 | 78 | 72 | 69 | 77 | 83 | 84 | 85 | 86 |
| 2012 | 71 | 73 | 64 | 88 | 77 | 73 | 92 | 85 | 77 | 77 | 88 | 81 |
| 2013 | 83 | 63 | 80 | 88 | 84 | 83 | 88 | 90 | 75 | 71 | 89 | 87 |
| 2014 | 63 | 62 | 80 | 85 | 93 | 95 | 92 | 90 | 63 | 75 | 81 | 87 |
| 2015 | 86 | 67 | 66 | 70 | 95 | 97 | 99 | 92 | 95 | 102 | 101 | 99 |
| 2016 | 130 | 118 | 122 | 125 | 130 | 133 | 129 | 129 | 123 | 89 | 99 | 132 |
| 2017 | 117 | 106 | 92 | 116 | 133 | 138 | 138 | 118 | 113 | 114 | 118 | 133 |
| 2018 | 136 | 132 | 132 | 132 | 136 | 138 | 134 | 130 | 121 | 100 | 110 | 132 |
| 2019 | 128 | 131 | 129 | 128 | 131 | 131 | 122 | 131 | 131 | 135 | 131 | 131 |
| 2020 | 128 | 131 | 132 | 97 | 83 | 106 | 125 | 127 | 125 | 127 | 128 | 126 |
| 2021 | 115 | 65 | 87 | 105 | 102 | 122 | 128 | 130 | 125 | 133 | 116 | 108 |
| 2022 | 116 | 110 | 128 | 133 | 122 | 117 | 128 | 131 | 130 | 135 | 138 | 134 |
| 2023 | 125 | 115 | 129 | 133 | 131 | 130 | 131 | 115 | 124 | 128 | 134 | 134 |
| 2024 | 128 | |||||||||||
| - = No Data Reported; -- = Not Applicable; NA = Not Available; W = Withheld to avoid disclosure of individual company data. |
| Release Date: 3/29/2024 |
| Next Release Date: 4/30/2024 |