|
Download Data (XLS File) |
|
||||||||
|
||||||||
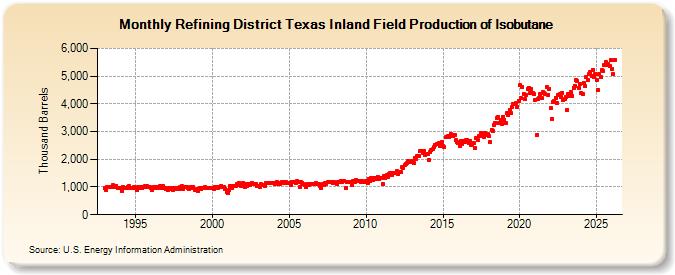
| Refining District Texas Inland Field Production of Isobutane (Thousand Barrels) | ||||||||
| Year | Jan | Feb | Mar | Apr | May | Jun | Jul | Aug | Sep | Oct | Nov | Dec |
|---|---|---|---|---|---|---|---|---|---|---|---|---|
| 1993 | 955 | 899 | 1,000 | 994 | 1,008 | 1,007 | 1,062 | 1,010 | 986 | 1,048 | 951 | 949 |
| 1994 | 971 | 866 | 1,000 | 969 | 980 | 977 | 1,016 | 1,028 | 967 | 980 | 962 | 995 |
| 1995 | 971 | 890 | 982 | 964 | 982 | 955 | 1,017 | 1,020 | 1,005 | 1,020 | 993 | 986 |
| 1996 | 952 | 890 | 985 | 980 | 995 | 965 | 988 | 1,020 | 962 | 1,042 | 955 | 965 |
| 1997 | 920 | 878 | 947 | 930 | 977 | 907 | 966 | 978 | 939 | 974 | 928 | 983 |
| 1998 | 1,019 | 920 | 1,010 | 1,016 | 1,006 | 950 | 940 | 1,007 | 964 | 1,001 | 907 | 899 |
| 1999 | 936 | 864 | 948 | 942 | 955 | 968 | 990 | 960 | 956 | 978 | 947 | 950 |
| 2000 | 949 | 911 | 1,009 | 982 | 977 | 984 | 1,014 | 1,037 | 982 | 1,003 | 936 | 817 |
| 2001 | 789 | 888 | 1,043 | 962 | 1,048 | 1,042 | 1,051 | 1,107 | 1,069 | 1,137 | 1,048 | 1,073 |
| 2002 | 1,135 | 991 | 1,096 | 1,038 | 1,116 | 1,086 | 1,118 | 1,142 | 1,110 | 1,125 | 1,099 | 1,044 |
| 2003 | 1,046 | 1,001 | 1,110 | 1,069 | 1,060 | 1,052 | 1,151 | 1,149 | 1,131 | 1,157 | 1,134 | 1,135 |
| 2004 | 1,152 | 1,110 | 1,192 | 1,125 | 1,132 | 1,114 | 1,176 | 1,180 | 1,158 | 1,179 | 1,130 | 1,137 |
| 2005 | 1,153 | 1,070 | 1,192 | 1,176 | 1,182 | 1,149 | 1,215 | 1,182 | 985 | 1,173 | 1,148 | 1,103 |
| 2006 | 1,070 | 983 | 1,100 | 1,073 | 1,111 | 1,104 | 1,111 | 1,111 | 1,126 | 1,141 | 1,090 | 1,108 |
| 2007 | 1,040 | 978 | 1,125 | 1,060 | 1,129 | 1,125 | 1,173 | 1,183 | 1,177 | 1,198 | 1,158 | 1,166 |
| 2008 | 1,141 | 1,113 | 1,187 | 1,182 | 1,218 | 1,180 | 1,210 | 1,205 | 977 | 1,187 | 1,174 | 1,171 |
| 2009 | 1,195 | 1,062 | 1,210 | 1,176 | 1,244 | 1,199 | 1,215 | 1,217 | 1,183 | 1,223 | 1,186 | 1,185 |
| 2010 | 1,214 | 1,136 | 1,300 | 1,222 | 1,311 | 1,241 | 1,313 | 1,310 | 1,302 | 1,371 | 1,301 | 1,330 |
| 2011 | 1,335 | 1,118 | 1,399 | 1,334 | 1,430 | 1,367 | 1,476 | 1,487 | 1,440 | 1,521 | 1,519 | 1,489 |
| 2012 | 1,561 | 1,468 | 1,552 | 1,557 | 1,711 | 1,688 | 1,798 | 1,833 | 1,865 | 1,936 | 1,917 | 1,892 |
| 2013 | 1,945 | 1,865 | 2,040 | 2,021 | 2,129 | 2,113 | 2,281 | 2,295 | 2,242 | 2,313 | 2,160 | 2,187 |
| 2014 | 2,182 | 1,985 | 2,251 | 2,321 | 2,365 | 2,426 | 2,515 | 2,544 | 2,569 | 2,582 | 2,488 | 2,626 |
| 2015 | 2,472 | 2,445 | 2,791 | 2,794 | 2,826 | 2,790 | 2,915 | 2,875 | 2,846 | 2,870 | 2,682 | 2,641 |
| 2016 | 2,594 | 2,488 | 2,656 | 2,568 | 2,657 | 2,630 | 2,681 | 2,700 | 2,603 | 2,664 | 2,504 | 2,509 |
| 2017 | 2,602 | 2,408 | 2,765 | 2,695 | 2,834 | 2,845 | 2,959 | 2,882 | 2,811 | 2,955 | 2,888 | 2,913 |
| 2018 | 2,835 | 2,628 | 3,061 | 3,031 | 3,244 | 3,312 | 3,488 | 3,542 | 3,326 | 3,424 | 3,288 | 3,543 |
| 2019 | 3,409 | 3,294 | 3,660 | 3,594 | 3,791 | 3,668 | 3,880 | 3,993 | 3,986 | 4,031 | 3,889 | 4,108 |
| 2020 | 4,674 | 4,196 | 4,602 | 4,372 | 4,160 | 4,331 | 4,542 | 4,588 | 4,377 | 4,543 | 4,381 | 4,338 |
| 2021 | 4,132 | 2,890 | 4,160 | 4,221 | 4,348 | 4,217 | 4,410 | 4,379 | 4,346 | 4,600 | 4,329 | 4,546 |
| 2022 | 3,840 | 3,461 | 4,059 | 4,087 | 4,221 | 4,032 | 4,321 | 4,361 | 4,248 | 4,402 | 4,143 | 4,159 |
| 2023 | 4,673 | 4,167 | 4,821 | 4,251 | 4,534 | 4,358 | 4,633 | 4,698 | 4,692 | 4,745 | 4,551 | 4,647 |
| 2024 | 4,393 | |||||||||||
| - = No Data Reported; -- = Not Applicable; NA = Not Available; W = Withheld to avoid disclosure of individual company data. |
| Release Date: 3/29/2024 |
| Next Release Date: 4/30/2024 |