|
Download Data (XLS File) |
|
||||||||
|
||||||||
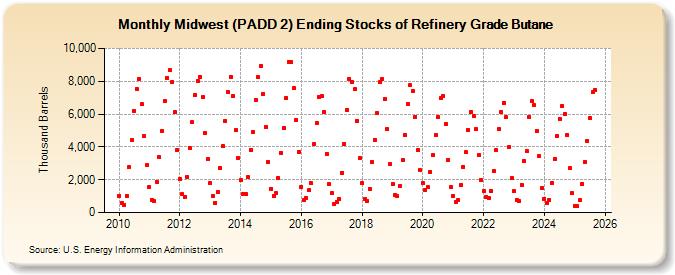
| Midwest (PADD 2) Ending Stocks of Refinery Grade Butane (Thousand Barrels) | ||||||||
| Year | Jan | Feb | Mar | Apr | May | Jun | Jul | Aug | Sep | Oct | Nov | Dec |
|---|---|---|---|---|---|---|---|---|---|---|---|---|
| 2010 | 1,028 | 588 | 471 | 1,024 | 2,751 | 4,396 | 6,213 | 7,555 | 8,150 | 6,586 | 4,641 | 2,880 |
| 2011 | 1,560 | 764 | 675 | 1,875 | 3,360 | 4,997 | 6,802 | 8,214 | 8,673 | 7,937 | 6,120 | 3,813 |
| 2012 | 2,063 | 1,101 | 977 | 2,175 | 3,920 | 5,506 | 7,179 | 8,006 | 8,286 | 7,038 | 4,846 | 3,240 |
| 2013 | 1,794 | 1,029 | 610 | 1,278 | 2,720 | 4,027 | 5,586 | 7,315 | 8,276 | 7,109 | 5,011 | 3,353 |
| 2014 | 1,982 | 1,103 | 1,147 | 2,147 | 3,838 | 4,902 | 6,857 | 8,243 | 8,913 | 7,224 | 5,236 | 3,080 |
| 2015 | 1,451 | 1,038 | 1,175 | 2,094 | 3,651 | 5,154 | 6,995 | 9,188 | 9,144 | 7,569 | 5,649 | 3,710 |
| 2016 | 1,552 | 735 | 894 | 1,344 | 1,781 | 4,177 | 5,474 | 7,066 | 7,097 | 6,134 | 3,584 | 1,717 |
| 2017 | 1,166 | 507 | 666 | 814 | 2,439 | 4,199 | 6,243 | 8,143 | 7,967 | 7,505 | 5,605 | 3,294 |
| 2018 | 1,775 | 836 | 729 | 1,439 | 3,070 | 4,447 | 6,055 | 7,942 | 8,127 | 6,940 | 5,068 | 2,933 |
| 2019 | 1,726 | 1,070 | 1,005 | 1,630 | 3,175 | 4,725 | 6,598 | 7,745 | 7,416 | 5,850 | 3,820 | 2,574 |
| 2020 | 1,778 | 1,404 | 1,540 | 2,481 | 3,480 | 4,734 | 5,816 | 6,972 | 7,105 | 5,395 | 3,212 | 1,570 |
| 2021 | 1,031 | 650 | 751 | 1,686 | 2,791 | 3,659 | 5,024 | 6,146 | 5,871 | 5,083 | 3,500 | 2,005 |
| 2022 | 1,298 | 952 | 873 | 1,299 | 2,532 | 3,786 | 5,060 | 6,131 | 6,703 | 5,796 | 3,991 | 2,094 |
| 2023 | 1,305 | 794 | 685 | 1,703 | 3,159 | 3,727 | 5,814 | 6,794 | 6,535 | 4,996 | 3,415 | 1,492 |
| 2024 | 848 | 587 | 772 | 1,823 | ||||||||
| - = No Data Reported; -- = Not Applicable; NA = Not Available; W = Withheld to avoid disclosure of individual company data. |
| Release Date: 6/28/2024 |
| Next Release Date: 7/31/2024 |