|
Download Data (XLS File) |
|
||||||||
|
||||||||
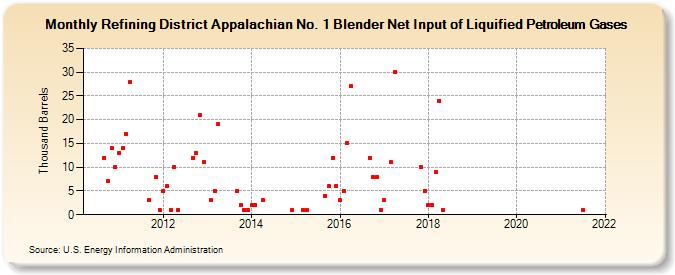
| Refining District Appalachian No. 1 Blender Net Input of Liquified Petroleum Gases (Thousand Barrels) | ||||||||
| Year | Jan | Feb | Mar | Apr | May | Jun | Jul | Aug | Sep | Oct | Nov | Dec |
|---|---|---|---|---|---|---|---|---|---|---|---|---|
| 2010 | 12 | 7 | 14 | 10 | ||||||||
| 2011 | 13 | 14 | 17 | 28 | 3 | 8 | 1 | |||||
| 2012 | 5 | 6 | 1 | 10 | 1 | 12 | 13 | 21 | 11 | |||
| 2013 | 3 | 5 | 19 | 5 | 2 | 1 | 1 | |||||
| 2014 | 2 | 2 | 3 | 1 | ||||||||
| 2015 | 1 | 1 | 4 | 6 | 12 | 6 | ||||||
| 2016 | 3 | 5 | 15 | 27 | 12 | 8 | 8 | 1 | ||||
| 2017 | 3 | 11 | 30 | 10 | 5 | |||||||
| 2018 | 2 | 2 | 9 | 24 | 1 | |||||||
| 2021 | 1 | |||||||||||
| - = No Data Reported; -- = Not Applicable; NA = Not Available; W = Withheld to avoid disclosure of individual company data. |
| Release Date: 6/30/2025 |
| Next Release Date: 7/31/2025 |