|
Download Data (XLS File) |
|
||||||||
|
||||||||
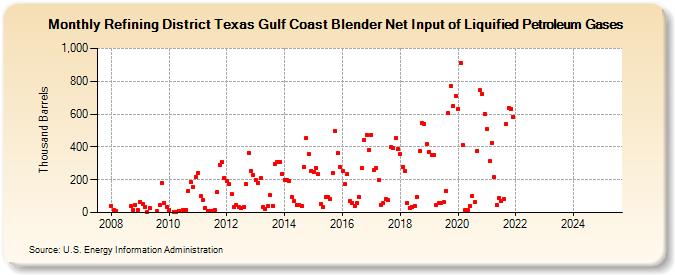
| Refining District Texas Gulf Coast Blender Net Input of Liquified Petroleum Gases (Thousand Barrels) | ||||||||
| Year | Jan | Feb | Mar | Apr | May | Jun | Jul | Aug | Sep | Oct | Nov | Dec |
|---|---|---|---|---|---|---|---|---|---|---|---|---|
| 2008 | 40 | 14 | 11 | 38 | 17 | 49 | 18 | |||||
| 2009 | 66 | 51 | 35 | 3 | 26 | 7 | 49 | 181 | 61 | 36 | ||
| 2010 | 18 | 5 | 3 | 12 | 15 | 18 | 130 | 184 | 157 | 219 | ||
| 2011 | 242 | 98 | 74 | 30 | 7 | 10 | 7 | 17 | 123 | 291 | 309 | 212 |
| 2012 | 195 | 172 | 112 | 33 | 45 | 31 | 28 | 35 | 175 | 365 | 256 | 231 |
| 2013 | 196 | 181 | 210 | 35 | 23 | 39 | 106 | 43 | 297 | 309 | 308 | 237 |
| 2014 | 201 | 199 | 193 | 97 | 70 | 45 | 44 | 40 | 277 | 455 | 354 | 256 |
| 2015 | 250 | 274 | 232 | 54 | 31 | 92 | 93 | 80 | 240 | 498 | 360 | 278 |
| 2016 | 253 | 171 | 234 | 69 | 59 | 39 | 60 | 94 | 273 | 444 | 474 | 383 |
| 2017 | 475 | 259 | 271 | 196 | 48 | 56 | 81 | 74 | 397 | 394 | 453 | 389 |
| 2018 | 358 | 278 | 252 | 58 | 30 | 34 | 43 | 93 | 373 | 548 | 540 | 417 |
| 2019 | 369 | 349 | 349 | 47 | 58 | 60 | 64 | 134 | 606 | 768 | 650 | 711 |
| 2020 | 631 | 912 | 411 | 15 | 15 | 40 | 100 | 62 | 376 | 746 | 725 | 603 |
| 2021 | 509 | 312 | 426 | 214 | 46 | 90 | 69 | 84 | 537 | 639 | 631 | 581 |
| 2022 | -- | -- | -- | -- | -- | -- | -- | -- | -- | -- | -- | -- |
| 2023 | -- | -- | -- | -- | -- | -- | -- | -- | -- | -- | -- | -- |
| 2024 | -- | -- | -- | -- | -- | -- | ||||||
| - = No Data Reported; -- = Not Applicable; NA = Not Available; W = Withheld to avoid disclosure of individual company data. |
| Release Date: 8/30/2024 |
| Next Release Date: 9/30/2024 |