|
Download Data (XLS File) |
|
||||||||
|
||||||||
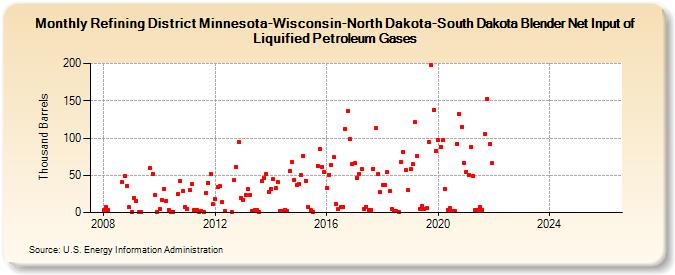
| Refining District Minnesota-Wisconsin-North Dakota-South Dakota Blender Net Input of Liquified Petroleum Gases (Thousand Barrels) | ||||||||
| Year | Jan | Feb | Mar | Apr | May | Jun | Jul | Aug | Sep | Oct | Nov | Dec |
|---|---|---|---|---|---|---|---|---|---|---|---|---|
| 2008 | 3 | 7 | 3 | 41 | 49 | 36 | 7 | |||||
| 2009 | 1 | 20 | 16 | 1 | 1 | 60 | 52 | 24 | 1 | |||
| 2010 | 5 | 17 | 32 | 16 | 4 | 1 | 1 | 25 | 42 | 29 | 8 | |
| 2011 | 5 | 30 | 38 | 4 | 3 | 1 | 2 | 1 | 26 | 40 | 52 | 11 |
| 2012 | 18 | 34 | 35 | 14 | 2 | 1 | 44 | 61 | 95 | 20 | ||
| 2013 | 17 | 24 | 31 | 24 | 2 | 3 | 3 | 1 | 42 | 47 | 52 | 28 |
| 2014 | 32 | 45 | 33 | 41 | 2 | 2 | 4 | 2 | 56 | 68 | 44 | 37 |
| 2015 | 38 | 50 | 76 | 43 | 8 | 4 | 1 | 63 | 85 | 61 | 55 | |
| 2016 | 33 | 51 | 64 | 74 | 12 | 5 | 8 | 8 | 112 | 136 | 99 | 65 |
| 2017 | 66 | 47 | 52 | 58 | 5 | 8 | 3 | 4 | 59 | 113 | 52 | 27 |
| 2018 | 37 | 37 | 54 | 29 | 5 | 2 | 2 | 1 | 68 | 81 | 57 | 30 |
| 2019 | 58 | 65 | 121 | 76 | 5 | 9 | 5 | 6 | 94 | 198 | 138 | 83 |
| 2020 | 97 | 88 | 97 | 32 | 4 | 6 | 2 | 2 | 92 | 132 | 115 | 67 |
| 2021 | 55 | 51 | 88 | 49 | 3 | 4 | 7 | 4 | 105 | 153 | 92 | 66 |
| 2022 | -- | -- | -- | -- | -- | -- | -- | -- | -- | -- | -- | -- |
| 2023 | -- | -- | -- | -- | -- | -- | -- | -- | -- | -- | -- | -- |
| 2024 | -- | |||||||||||
| - = No Data Reported; -- = Not Applicable; NA = Not Available; W = Withheld to avoid disclosure of individual company data. |
| Release Date: 3/29/2024 |
| Next Release Date: 4/30/2024 |