|
Download Data (XLS File) |
|
||||||||
|
||||||||
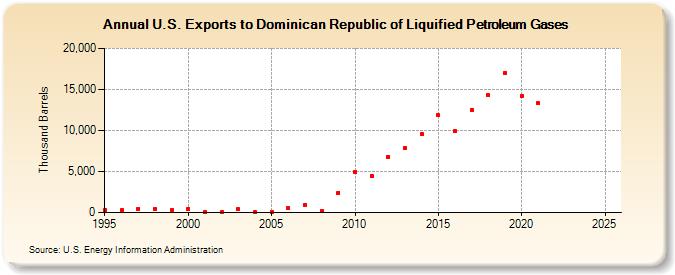
| U.S. Exports to Dominican Republic of Liquified Petroleum Gases (Thousand Barrels) | ||||||||
| Decade | Year-0 | Year-1 | Year-2 | Year-3 | Year-4 | Year-5 | Year-6 | Year-7 | Year-8 | Year-9 |
|---|---|---|---|---|---|---|---|---|---|---|
| 1990's | 307 | 284 | 487 | 445 | 315 | |||||
| 2000's | 490 | 93 | 90 | 378 | 37 | 128 | 538 | 977 | 250 | 2,439 |
| 2010's | 4,993 | 4,498 | 6,829 | 7,847 | 9,535 | 11,841 | 9,882 | 12,502 | 14,268 | 17,052 |
| 2020's | 14,256 | 13,309 | -- | -- |
| - = No Data Reported; -- = Not Applicable; NA = Not Available; W = Withheld to avoid disclosure of individual company data. |
| Release Date: 4/30/2024 |
| Next Release Date: 8/30/2024 |