|
Download Data (XLS File) |
|
||||||||
|
||||||||
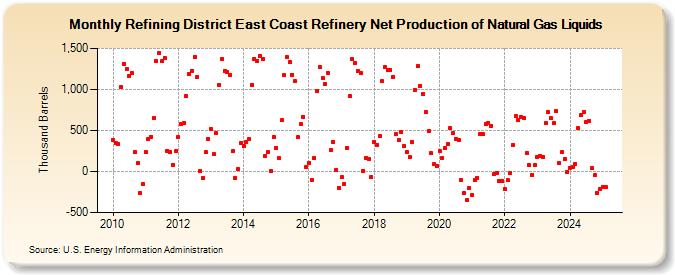
| Refining District East Coast Refinery Net Production of Natural Gas Liquids (Thousand Barrels) | ||||||||
| Year | Jan | Feb | Mar | Apr | May | Jun | Jul | Aug | Sep | Oct | Nov | Dec |
|---|---|---|---|---|---|---|---|---|---|---|---|---|
| 2010 | 387 | 342 | 336 | 1,031 | 1,315 | 1,251 | 1,164 | 1,203 | 235 | 101 | -264 | -155 |
| 2011 | 241 | 394 | 424 | 654 | 1,344 | 1,449 | 1,343 | 1,387 | 256 | 239 | 85 | 246 |
| 2012 | 418 | 573 | 587 | 917 | 1,193 | 1,225 | 1,396 | 1,151 | 7 | -79 | 234 | 396 |
| 2013 | 515 | 208 | 471 | 1,057 | 1,375 | 1,225 | 1,213 | 1,177 | 244 | -77 | 27 | 350 |
| 2014 | 307 | 362 | 395 | 1,059 | 1,375 | 1,350 | 1,409 | 1,370 | 186 | 235 | 8 | 423 |
| 2015 | 289 | 164 | 622 | 1,171 | 1,390 | 1,334 | 1,180 | 1,101 | 416 | 575 | 669 | 58 |
| 2016 | 105 | -100 | 167 | 986 | 1,273 | 1,143 | 1,066 | 1,202 | 257 | 359 | 16 | -196 |
| 2017 | -67 | -148 | 287 | 915 | 1,365 | 1,325 | 1,226 | 1,201 | 10 | 169 | 153 | -64 |
| 2018 | 363 | 326 | 427 | 1,099 | 1,269 | 1,237 | 1,242 | 1,153 | 456 | 382 | 480 | 316 |
| 2019 | 235 | 175 | 363 | 997 | 1,287 | 1,047 | 945 | 726 | 495 | 222 | 88 | 66 |
| 2020 | 246 | 170 | 287 | 334 | 525 | 464 | 398 | 389 | -101 | -260 | -353 | -200 |
| 2021 | -289 | -109 | -84 | 458 | 452 | 577 | 590 | 556 | -28 | -17 | -120 | -112 |
| 2022 | -216 | -108 | -24 | 324 | 675 | 624 | 667 | 656 | 225 | 76 | -38 | 78 |
| 2023 | 181 | 187 | 178 | 591 | 720 | 650 | 588 | 734 | 101 | 233 | 151 | -8 |
| 2024 | 48 | |||||||||||
| - = No Data Reported; -- = Not Applicable; NA = Not Available; W = Withheld to avoid disclosure of individual company data. |
| Release Date: 3/29/2024 |
| Next Release Date: 4/30/2024 |