|
Download Data (XLS File) |
|
||||||||
|
||||||||
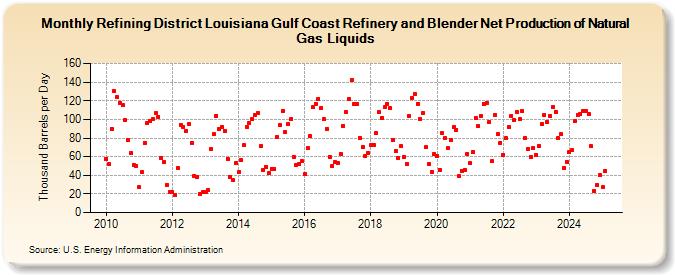
| Refining District Louisiana Gulf Coast Refinery and Blender Net Production of Natural Gas Liquids (Thousand Barrels per Day) | ||||||||
| Year | Jan | Feb | Mar | Apr | May | Jun | Jul | Aug | Sep | Oct | Nov | Dec |
|---|---|---|---|---|---|---|---|---|---|---|---|---|
| 2010 | 58 | 52 | 90 | 130 | 124 | 118 | 115 | 99 | 78 | 64 | 51 | 50 |
| 2011 | 27 | 43 | 75 | 96 | 98 | 100 | 107 | 103 | 59 | 54 | 30 | 22 |
| 2012 | 22 | 19 | 48 | 94 | 92 | 88 | 95 | 75 | 39 | 38 | 20 | 22 |
| 2013 | 22 | 24 | 68 | 84 | 104 | 90 | 92 | 88 | 58 | 38 | 35 | 53 |
| 2014 | 43 | 56 | 72 | 92 | 96 | 100 | 105 | 107 | 71 | 46 | 49 | 42 |
| 2015 | 47 | 47 | 81 | 94 | 109 | 86 | 95 | 100 | 60 | 51 | 52 | 55 |
| 2016 | 41 | 69 | 82 | 113 | 117 | 122 | 112 | 100 | 90 | 60 | 50 | 54 |
| 2017 | 53 | 63 | 93 | 108 | 122 | 142 | 116 | 117 | 80 | 70 | 61 | 64 |
| 2018 | 72 | 73 | 85 | 108 | 102 | 113 | 117 | 112 | 78 | 66 | 59 | 71 |
| 2019 | 60 | 52 | 104 | 123 | 127 | 117 | 100 | 107 | 70 | 52 | 44 | 63 |
| 2020 | 61 | 46 | 85 | 80 | 69 | 78 | 92 | 89 | 39 | 45 | 46 | 63 |
| 2021 | 53 | 65 | 102 | 93 | 104 | 117 | 118 | 97 | 55 | 105 | 84 | 75 |
| 2022 | 62 | 80 | 92 | 104 | 99 | 108 | 100 | 109 | 80 | 68 | 60 | 69 |
| 2023 | 62 | 71 | 95 | 105 | 97 | 104 | 113 | 108 | 80 | 84 | 48 | 54 |
| 2024 | 65 | 67 | 98 | 105 | ||||||||
| - = No Data Reported; -- = Not Applicable; NA = Not Available; W = Withheld to avoid disclosure of individual company data. |
| Release Date: 6/28/2024 |
| Next Release Date: 7/31/2024 |