|
Download Data (XLS File) |
|
||||||||
|
||||||||
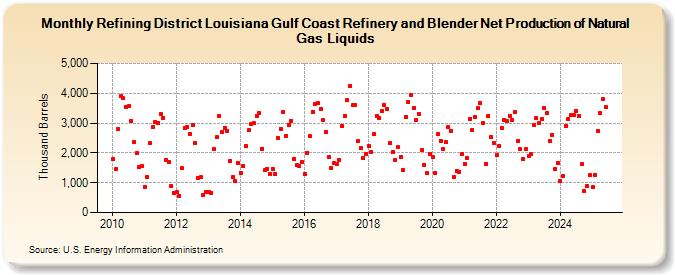
| Refining District Louisiana Gulf Coast Refinery and Blender Net Production of Natural Gas Liquids (Thousand Barrels) | ||||||||
| Year | Jan | Feb | Mar | Apr | May | Jun | Jul | Aug | Sep | Oct | Nov | Dec |
|---|---|---|---|---|---|---|---|---|---|---|---|---|
| 2010 | 1,786 | 1,447 | 2,805 | 3,894 | 3,833 | 3,548 | 3,566 | 3,081 | 2,354 | 1,991 | 1,521 | 1,548 |
| 2011 | 851 | 1,191 | 2,325 | 2,867 | 3,032 | 3,012 | 3,316 | 3,178 | 1,772 | 1,683 | 892 | 667 |
| 2012 | 684 | 561 | 1,484 | 2,825 | 2,858 | 2,651 | 2,945 | 2,340 | 1,164 | 1,183 | 589 | 694 |
| 2013 | 689 | 664 | 2,115 | 2,518 | 3,228 | 2,686 | 2,850 | 2,728 | 1,743 | 1,190 | 1,046 | 1,658 |
| 2014 | 1,330 | 1,555 | 2,238 | 2,753 | 2,978 | 2,998 | 3,246 | 3,326 | 2,143 | 1,418 | 1,471 | 1,305 |
| 2015 | 1,454 | 1,304 | 2,509 | 2,813 | 3,388 | 2,574 | 2,949 | 3,087 | 1,809 | 1,579 | 1,551 | 1,700 |
| 2016 | 1,285 | 2,008 | 2,552 | 3,380 | 3,640 | 3,662 | 3,482 | 3,089 | 2,705 | 1,875 | 1,496 | 1,673 |
| 2017 | 1,644 | 1,763 | 2,891 | 3,244 | 3,788 | 4,256 | 3,594 | 3,613 | 2,387 | 2,162 | 1,824 | 1,974 |
| 2018 | 2,228 | 2,040 | 2,635 | 3,233 | 3,170 | 3,403 | 3,614 | 3,486 | 2,340 | 2,033 | 1,759 | 2,199 |
| 2019 | 1,862 | 1,444 | 3,217 | 3,702 | 3,951 | 3,509 | 3,115 | 3,308 | 2,105 | 1,608 | 1,317 | 1,961 |
| 2020 | 1,876 | 1,333 | 2,620 | 2,411 | 2,133 | 2,352 | 2,858 | 2,749 | 1,178 | 1,397 | 1,371 | 1,949 |
| 2021 | 1,630 | 1,823 | 3,151 | 2,779 | 3,218 | 3,498 | 3,664 | 3,010 | 1,639 | 3,254 | 2,533 | 2,325 |
| 2022 | 1,924 | 2,231 | 2,844 | 3,118 | 3,061 | 3,253 | 3,109 | 3,388 | 2,401 | 2,116 | 1,788 | 2,138 |
| 2023 | 1,913 | 1,976 | 2,931 | 3,161 | 3,010 | 3,122 | 3,495 | 3,336 | 2,387 | 2,607 | 1,451 | 1,669 |
| 2024 | 2,020 | 1,929 | 3,024 | 3,153 | ||||||||
| - = No Data Reported; -- = Not Applicable; NA = Not Available; W = Withheld to avoid disclosure of individual company data. |
| Release Date: 6/28/2024 |
| Next Release Date: 7/31/2024 |