|
Download Data (XLS File) |
|
||||||||
|
||||||||
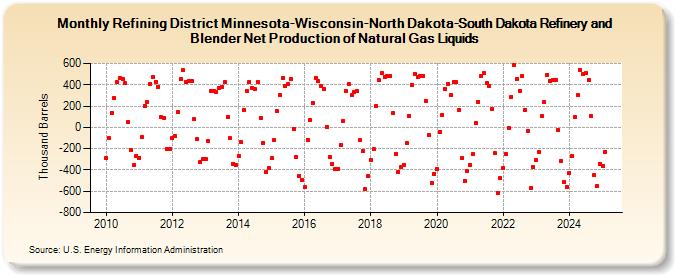
| Refining District Minnesota-Wisconsin-North Dakota-South Dakota Refinery and Blender Net Production of Natural Gas Liquids (Thousand Barrels) | ||||||||
| Year | Jan | Feb | Mar | Apr | May | Jun | Jul | Aug | Sep | Oct | Nov | Dec |
|---|---|---|---|---|---|---|---|---|---|---|---|---|
| 2010 | -288 | -103 | 138 | 274 | 424 | 462 | 456 | 413 | 53 | -213 | -355 | -266 |
| 2011 | -283 | -93 | 204 | 235 | 412 | 469 | 430 | 382 | 95 | 91 | -202 | -205 |
| 2012 | -100 | -79 | 148 | 454 | 535 | 427 | 437 | 438 | 74 | -110 | -327 | -300 |
| 2013 | -299 | -131 | 343 | 340 | 328 | 368 | 383 | 426 | 100 | -104 | -341 | -352 |
| 2014 | -273 | -142 | 167 | 345 | 430 | 372 | 359 | 428 | 88 | -143 | -415 | -385 |
| 2015 | -289 | -117 | 150 | 305 | 466 | 388 | 405 | 453 | -13 | -275 | -456 | -492 |
| 2016 | -564 | -116 | 68 | 229 | 467 | 432 | 388 | 361 | 5 | -279 | -343 | -395 |
| 2017 | -388 | -162 | 64 | 343 | 404 | 301 | 336 | 338 | -123 | -226 | -579 | -456 |
| 2018 | -306 | -204 | 202 | 442 | 507 | 475 | 483 | 478 | 131 | -249 | -416 | -374 |
| 2019 | -349 | -149 | 110 | 401 | 505 | 475 | 481 | 484 | 249 | -67 | -524 | -434 |
| 2020 | -390 | -40 | 117 | 357 | 409 | 305 | 428 | 423 | 160 | -287 | -501 | -412 |
| 2021 | -349 | -252 | 41 | 241 | 478 | 510 | 418 | 393 | 176 | -244 | -615 | -480 |
| 2022 | -380 | -249 | -5 | 289 | 587 | 456 | 346 | 480 | 166 | -38 | -566 | -372 |
| 2023 | -307 | -234 | 103 | 203 | 477 | 411 | 446 | 449 | -26 | -312 | -516 | -558 |
| 2024 | -427 | -265 | 100 | 303 | ||||||||
| - = No Data Reported; -- = Not Applicable; NA = Not Available; W = Withheld to avoid disclosure of individual company data. |
| Release Date: 6/28/2024 |
| Next Release Date: 7/31/2024 |