|
Download Data (XLS File) |
|
||||||||
|
||||||||
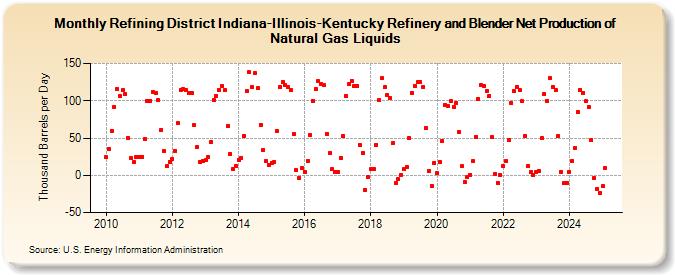
| Refining District Indiana-Illinois-Kentucky Refinery and Blender Net Production of Natural Gas Liquids (Thousand Barrels per Day) | ||||||||
| Year | Jan | Feb | Mar | Apr | May | Jun | Jul | Aug | Sep | Oct | Nov | Dec |
|---|---|---|---|---|---|---|---|---|---|---|---|---|
| 2010 | 24 | 35 | 60 | 92 | 116 | 106 | 114 | 109 | 50 | 23 | 18 | 25 |
| 2011 | 25 | 25 | 49 | 100 | 100 | 112 | 111 | 101 | 61 | 32 | 12 | 18 |
| 2012 | 22 | 33 | 70 | 115 | 116 | 114 | 111 | 111 | 67 | 38 | 18 | 19 |
| 2013 | 20 | 25 | 44 | 101 | 107 | 115 | 120 | 114 | 66 | 29 | 9 | 12 |
| 2014 | 21 | 23 | 53 | 113 | 138 | 118 | 137 | 117 | 68 | 34 | 19 | 14 |
| 2015 | 17 | 18 | 60 | 118 | 125 | 121 | 118 | 114 | 56 | 7 | -4 | 10 |
| 2016 | 5 | 19 | 54 | 100 | 116 | 126 | 123 | 121 | 56 | 30 | 8 | 4 |
| 2017 | 5 | 23 | 53 | 107 | 122 | 127 | 120 | 120 | 41 | 30 | -20 | -2 |
| 2018 | 8 | 8 | 41 | 101 | 130 | 118 | 108 | 104 | 43 | -10 | -5 | 1 |
| 2019 | 8 | 11 | 50 | 111 | 120 | 125 | 125 | 119 | 64 | 6 | -14 | 17 |
| 2020 | 3 | 18 | 46 | 94 | 93 | 99 | 92 | 97 | 58 | 12 | -9 | -2 |
| 2021 | 1 | 19 | 52 | 103 | 121 | 120 | 113 | 107 | 51 | 2 | -10 | 1 |
| 2022 | 12 | 19 | 47 | 97 | 113 | 119 | 114 | 99 | 53 | 12 | 4 | 1 |
| 2023 | 5 | 6 | 50 | 109 | 100 | 130 | 119 | 114 | 53 | 5 | -11 | -11 |
| 2024 | 5 | 19 | 37 | 85 | 115 | 111 | 99 | 92 | 47 | -3 | -18 | -24 |
| 2025 | -15 | 10 | 55 | 118 | ||||||||
| - = No Data Reported; -- = Not Applicable; NA = Not Available; W = Withheld to avoid disclosure of individual company data. |
| Release Date: 6/30/2025 |
| Next Release Date: 7/31/2025 |