|
Download Data (XLS File) |
|
||||||||
|
||||||||
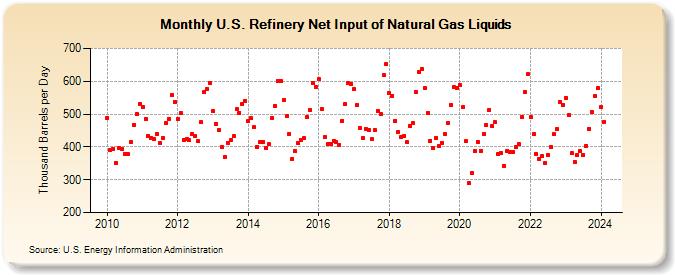
| U.S. Refinery Net Input of Natural Gas Liquids (Thousand Barrels per Day) | ||||||||
| Year | Jan | Feb | Mar | Apr | May | Jun | Jul | Aug | Sep | Oct | Nov | Dec |
|---|---|---|---|---|---|---|---|---|---|---|---|---|
| 2010 | 488 | 392 | 395 | 352 | 397 | 395 | 379 | 379 | 414 | 468 | 500 | 531 |
| 2011 | 522 | 486 | 434 | 428 | 424 | 440 | 412 | 428 | 473 | 485 | 558 | 537 |
| 2012 | 485 | 503 | 422 | 424 | 421 | 439 | 433 | 417 | 475 | 567 | 577 | 595 |
| 2013 | 508 | 471 | 450 | 400 | 368 | 413 | 420 | 432 | 514 | 504 | 531 | 541 |
| 2014 | 478 | 487 | 460 | 401 | 414 | 416 | 397 | 408 | 489 | 525 | 600 | 600 |
| 2015 | 542 | 494 | 440 | 364 | 387 | 411 | 422 | 427 | 490 | 513 | 596 | 583 |
| 2016 | 606 | 515 | 430 | 408 | 409 | 419 | 414 | 405 | 480 | 530 | 595 | 592 |
| 2017 | 576 | 528 | 458 | 427 | 456 | 451 | 423 | 451 | 510 | 501 | 618 | 651 |
| 2018 | 563 | 556 | 480 | 445 | 429 | 434 | 414 | 465 | 473 | 568 | 628 | 636 |
| 2019 | 579 | 504 | 419 | 396 | 427 | 403 | 413 | 438 | 473 | 529 | 583 | 580 |
| 2020 | 590 | 521 | 417 | 289 | 321 | 386 | 416 | 388 | 439 | 466 | 513 | 463 |
| 2021 | 475 | 377 | 380 | 343 | 388 | 384 | 385 | 400 | 408 | 491 | 567 | 621 |
| 2022 | 490 | 439 | 378 | 363 | 372 | 351 | 376 | 400 | 438 | 454 | 537 | 529 |
| 2023 | 549 | 497 | 380 | 354 | 375 | 386 | 375 | 404 | 456 | 507 | 555 | 579 |
| 2024 | 521 | |||||||||||
| - = No Data Reported; -- = Not Applicable; NA = Not Available; W = Withheld to avoid disclosure of individual company data. |
| Release Date: 3/29/2024 |
| Next Release Date: 4/30/2024 |
Referring Pages: