|
Download Data (XLS File) |
|
||||||||
|
||||||||
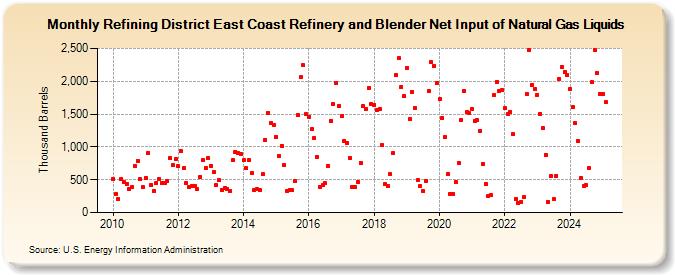
| Refining District East Coast Refinery and Blender Net Input of Natural Gas Liquids (Thousand Barrels) | ||||||||
| Year | Jan | Feb | Mar | Apr | May | Jun | Jul | Aug | Sep | Oct | Nov | Dec |
|---|---|---|---|---|---|---|---|---|---|---|---|---|
| 2010 | 516 | 276 | 210 | 507 | 462 | 442 | 360 | 390 | 714 | 790 | 507 | 383 |
| 2011 | 528 | 910 | 425 | 328 | 456 | 514 | 449 | 455 | 482 | 828 | 721 | 815 |
| 2012 | 702 | 936 | 673 | 455 | 395 | 412 | 404 | 358 | 543 | 795 | 685 | 826 |
| 2013 | 712 | 611 | 418 | 495 | 341 | 373 | 357 | 325 | 793 | 928 | 902 | 892 |
| 2014 | 795 | 674 | 800 | 597 | 342 | 354 | 336 | 583 | 1,111 | 1,523 | 1,364 | 1,334 |
| 2015 | 1,155 | 860 | 1,020 | 724 | 328 | 342 | 337 | 484 | 1,483 | 2,058 | 2,240 | 1,497 |
| 2016 | 1,461 | 1,266 | 1,139 | 850 | 391 | 421 | 446 | 710 | 1,400 | 1,649 | 1,969 | 1,622 |
| 2017 | 1,463 | 1,090 | 1,060 | 831 | 392 | 383 | 464 | 759 | 1,618 | 1,578 | 1,898 | 1,653 |
| 2018 | 1,638 | 1,564 | 1,579 | 1,032 | 433 | 406 | 580 | 902 | 2,093 | 2,348 | 1,918 | 1,770 |
| 2019 | 2,202 | 1,423 | 1,843 | 1,591 | 489 | 408 | 327 | 485 | 1,854 | 2,287 | 2,235 | 1,972 |
| 2020 | 1,722 | 1,446 | 1,147 | 583 | 290 | 289 | 468 | 760 | 1,413 | 1,851 | 1,535 | 1,510 |
| 2021 | 1,581 | 1,398 | 1,409 | 1,244 | 745 | 440 | 248 | 266 | 1,789 | 1,989 | 1,857 | 1,863 |
| 2022 | 1,585 | 1,505 | 1,534 | 1,192 | 201 | 152 | 163 | 232 | 1,805 | 2,471 | 1,949 | 1,880 |
| 2023 | 1,793 | 1,508 | 1,277 | 878 | 165 | 551 | 201 | 560 | 2,012 | 2,176 | 2,109 | 2,099 |
| 2024 | 1,884 | 1,602 | 1,357 | 1,091 | ||||||||
| - = No Data Reported; -- = Not Applicable; NA = Not Available; W = Withheld to avoid disclosure of individual company data. |
| Release Date: 6/28/2024 |
| Next Release Date: 7/31/2024 |