|
Download Data (XLS File) |
|
||||||||
|
||||||||
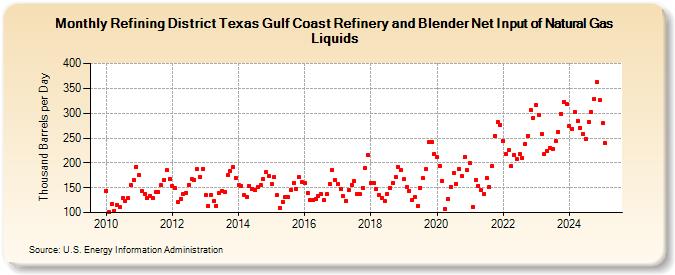
| Refining District Texas Gulf Coast Refinery and Blender Net Input of Natural Gas Liquids (Thousand Barrels per Day) | ||||||||
| Year | Jan | Feb | Mar | Apr | May | Jun | Jul | Aug | Sep | Oct | Nov | Dec |
|---|---|---|---|---|---|---|---|---|---|---|---|---|
| 2010 | 144 | 101 | 117 | 104 | 116 | 111 | 129 | 124 | 129 | 155 | 166 | 192 |
| 2011 | 176 | 143 | 138 | 130 | 134 | 129 | 141 | 141 | 155 | 166 | 185 | 168 |
| 2012 | 154 | 149 | 121 | 128 | 138 | 140 | 156 | 167 | 166 | 187 | 172 | 188 |
| 2013 | 135 | 114 | 136 | 123 | 114 | 139 | 143 | 142 | 176 | 184 | 191 | 170 |
| 2014 | 155 | 154 | 135 | 132 | 153 | 148 | 145 | 151 | 156 | 167 | 181 | 174 |
| 2015 | 157 | 172 | 135 | 110 | 122 | 132 | 132 | 146 | 160 | 148 | 171 | 161 |
| 2016 | 160 | 139 | 125 | 125 | 127 | 133 | 137 | 125 | 137 | 158 | 186 | 166 |
| 2017 | 158 | 148 | 133 | 124 | 145 | 156 | 163 | 137 | 137 | 150 | 190 | 215 |
| 2018 | 159 | 159 | 147 | 136 | 130 | 123 | 138 | 149 | 160 | 172 | 192 | 185 |
| 2019 | 167 | 152 | 143 | 126 | 132 | 114 | 150 | 169 | 187 | 241 | 241 | 218 |
| 2020 | 212 | 194 | 164 | 107 | 127 | 152 | 180 | 158 | 188 | 174 | 212 | 186 |
| 2021 | 199 | 112 | 165 | 154 | 146 | 138 | 170 | 151 | 194 | 255 | 282 | 276 |
| 2022 | 244 | 218 | 225 | 193 | 216 | 208 | 218 | 210 | 238 | 255 | 307 | 291 |
| 2023 | 316 | 297 | 259 | 217 | 223 | 230 | 227 | 243 | 263 | 299 | 323 | 318 |
| 2024 | 275 | 269 | 303 | 285 | 270 | 259 | 248 | 283 | 302 | 329 | 362 | 326 |
| 2025 | 280 | 240 | 221 | 248 | ||||||||
| - = No Data Reported; -- = Not Applicable; NA = Not Available; W = Withheld to avoid disclosure of individual company data. |
| Release Date: 6/30/2025 |
| Next Release Date: 7/31/2025 |