|
Download Data (XLS File) |
|
||||||||
|
||||||||
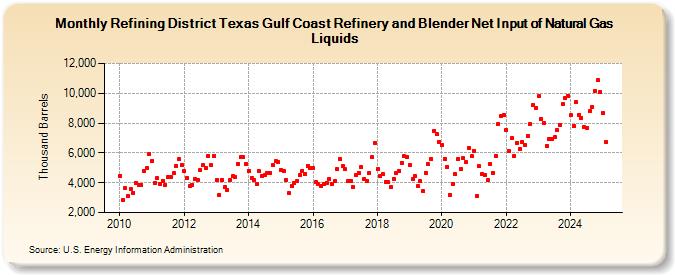
| Refining District Texas Gulf Coast Refinery and Blender Net Input of Natural Gas Liquids (Thousand Barrels) | ||||||||
| Year | Jan | Feb | Mar | Apr | May | Jun | Jul | Aug | Sep | Oct | Nov | Dec |
|---|---|---|---|---|---|---|---|---|---|---|---|---|
| 2010 | 4,475 | 2,838 | 3,625 | 3,118 | 3,591 | 3,329 | 4,013 | 3,829 | 3,855 | 4,803 | 4,979 | 5,956 |
| 2011 | 5,469 | 4,014 | 4,286 | 3,897 | 4,141 | 3,864 | 4,377 | 4,373 | 4,660 | 5,139 | 5,561 | 5,216 |
| 2012 | 4,766 | 4,331 | 3,765 | 3,844 | 4,268 | 4,210 | 4,846 | 5,170 | 4,989 | 5,804 | 5,171 | 5,822 |
| 2013 | 4,200 | 3,188 | 4,217 | 3,682 | 3,532 | 4,173 | 4,424 | 4,388 | 5,289 | 5,706 | 5,722 | 5,265 |
| 2014 | 4,809 | 4,325 | 4,189 | 3,945 | 4,756 | 4,432 | 4,507 | 4,669 | 4,671 | 5,163 | 5,441 | 5,401 |
| 2015 | 4,861 | 4,817 | 4,191 | 3,305 | 3,788 | 3,970 | 4,098 | 4,512 | 4,803 | 4,591 | 5,144 | 4,986 |
| 2016 | 4,964 | 4,020 | 3,883 | 3,764 | 3,924 | 4,002 | 4,236 | 3,889 | 4,095 | 4,904 | 5,581 | 5,136 |
| 2017 | 4,897 | 4,138 | 4,127 | 3,709 | 4,504 | 4,682 | 5,040 | 4,259 | 4,101 | 4,637 | 5,697 | 6,671 |
| 2018 | 4,926 | 4,453 | 4,554 | 4,081 | 4,027 | 3,691 | 4,281 | 4,628 | 4,813 | 5,346 | 5,773 | 5,727 |
| 2019 | 5,180 | 4,249 | 4,435 | 3,781 | 4,089 | 3,420 | 4,661 | 5,226 | 5,598 | 7,478 | 7,239 | 6,758 |
| 2020 | 6,560 | 5,619 | 5,079 | 3,202 | 3,935 | 4,566 | 5,587 | 4,898 | 5,631 | 5,405 | 6,350 | 5,766 |
| 2021 | 6,157 | 3,144 | 5,100 | 4,606 | 4,524 | 4,154 | 5,260 | 4,687 | 5,814 | 7,911 | 8,448 | 8,541 |
| 2022 | 7,552 | 6,100 | 6,972 | 5,800 | 6,684 | 6,254 | 6,744 | 6,525 | 7,150 | 7,919 | 9,211 | 9,021 |
| 2023 | 9,785 | 8,307 | 8,022 | 6,497 | 6,896 | 6,906 | 7,049 | 7,519 | 7,872 | 9,255 | 9,679 | 9,831 |
| 2024 | 8,521 | |||||||||||
| - = No Data Reported; -- = Not Applicable; NA = Not Available; W = Withheld to avoid disclosure of individual company data. |
| Release Date: 3/29/2024 |
| Next Release Date: 4/30/2024 |