|
Download Data (XLS File) |
|
||||||||
|
||||||||
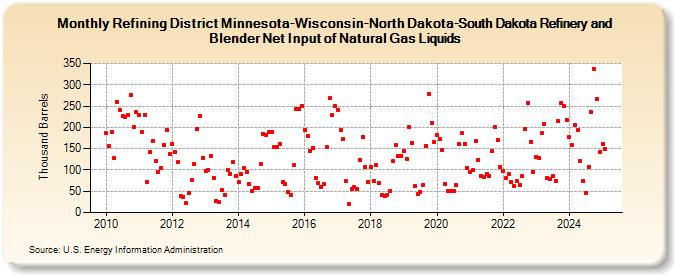
| Refining District Minnesota-Wisconsin-North Dakota-South Dakota Refinery and Blender Net Input of Natural Gas Liquids (Thousand Barrels) | ||||||||
| Year | Jan | Feb | Mar | Apr | May | Jun | Jul | Aug | Sep | Oct | Nov | Dec |
|---|---|---|---|---|---|---|---|---|---|---|---|---|
| 2010 | 186 | 156 | 188 | 127 | 259 | 240 | 226 | 224 | 230 | 277 | 202 | 235 |
| 2011 | 229 | 188 | 230 | 71 | 142 | 169 | 120 | 96 | 105 | 159 | 193 | 138 |
| 2012 | 162 | 142 | 119 | 39 | 37 | 22 | 45 | 76 | 113 | 197 | 227 | 129 |
| 2013 | 98 | 101 | 133 | 82 | 27 | 24 | 54 | 42 | 100 | 91 | 119 | 87 |
| 2014 | 71 | 91 | 104 | 95 | 66 | 50 | 57 | 57 | 113 | 184 | 183 | 188 |
| 2015 | 190 | 155 | 153 | 160 | 71 | 66 | 49 | 41 | 111 | 242 | 244 | 251 |
| 2016 | 194 | 180 | 144 | 152 | 82 | 69 | 59 | 66 | 154 | 270 | 228 | 250 |
| 2017 | 241 | 193 | 172 | 73 | 19 | 55 | 60 | 56 | 124 | 178 | 107 | 71 |
| 2018 | 107 | 73 | 111 | 69 | 41 | 38 | 42 | 50 | 121 | 158 | 133 | 133 |
| 2019 | 145 | 126 | 200 | 164 | 62 | 43 | 49 | 65 | 157 | 278 | 210 | 166 |
| 2020 | 181 | 172 | 147 | 68 | 51 | 51 | 51 | 64 | 160 | 186 | 162 | 105 |
| 2021 | 95 | 99 | 168 | 124 | 87 | 84 | 91 | 87 | 145 | 201 | 171 | 108 |
| 2022 | 98 | 80 | 91 | 72 | 62 | 74 | 64 | 85 | 197 | 258 | 166 | 96 |
| 2023 | 130 | 129 | 186 | 208 | 82 | 78 | 85 | 75 | 214 | 258 | 251 | 218 |
| 2024 | 177 | |||||||||||
| - = No Data Reported; -- = Not Applicable; NA = Not Available; W = Withheld to avoid disclosure of individual company data. |
| Release Date: 3/29/2024 |
| Next Release Date: 4/30/2024 |