|
Download Data (XLS File) |
|
||||||||
|
||||||||
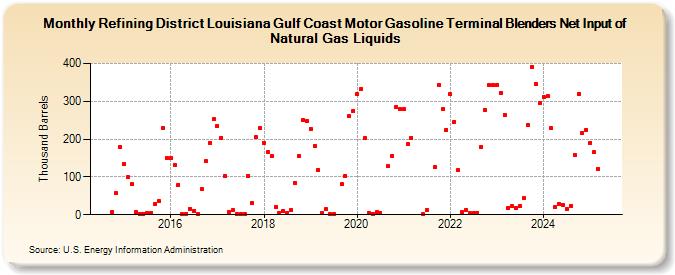
| Refining District Louisiana Gulf Coast Motor Gasoline Terminal Blenders Net Input of Natural Gas Liquids (Thousand Barrels) | ||||||||
| Year | Jan | Feb | Mar | Apr | May | Jun | Jul | Aug | Sep | Oct | Nov | Dec |
|---|---|---|---|---|---|---|---|---|---|---|---|---|
| 2014 | 7 | 57 | 179 | |||||||||
| 2015 | 134 | 100 | 81 | 7 | 2 | 2 | 5 | 5 | 29 | 36 | 230 | 151 |
| 2016 | 150 | 132 | 79 | 1 | 2 | 16 | 10 | 3 | 68 | 141 | 191 | 252 |
| 2017 | 234 | 204 | 103 | 8 | 12 | 3 | 1 | 2 | 103 | 31 | 205 | 229 |
| 2018 | 191 | 165 | 154 | 20 | 5 | 11 | 5 | 12 | 84 | 156 | 250 | 248 |
| 2019 | 227 | 182 | 119 | 5 | 14 | 2 | 1 | 80 | 103 | 260 | 273 | |
| 2020 | 318 | 333 | 202 | 5 | 3 | 7 | 5 | 128 | 156 | 285 | 280 | |
| 2021 | 279 | 187 | 203 | 1 | 12 | 125 | 342 | 279 | 225 | |||
| 2022 | 318 | 246 | 118 | 7 | 12 | 4 | 4 | 5 | 180 | 277 | 342 | 342 |
| 2023 | 344 | 323 | 265 | 19 | 23 | 19 | 23 | 43 | 237 | 392 | 346 | 295 |
| 2024 | 312 | |||||||||||
| - = No Data Reported; -- = Not Applicable; NA = Not Available; W = Withheld to avoid disclosure of individual company data. |
| Release Date: 3/29/2024 |
| Next Release Date: 4/30/2024 |