|
Download Data (XLS File) |
|
||||||||
|
||||||||
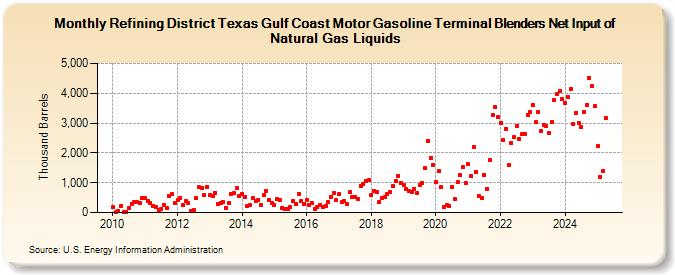
| Refining District Texas Gulf Coast Motor Gasoline Terminal Blenders Net Input of Natural Gas Liquids (Thousand Barrels) | ||||||||
| Year | Jan | Feb | Mar | Apr | May | Jun | Jul | Aug | Sep | Oct | Nov | Dec |
|---|---|---|---|---|---|---|---|---|---|---|---|---|
| 2010 | 178 | 21 | 58 | 214 | 12 | 34 | 155 | 296 | 338 | 366 | 335 | 494 |
| 2011 | 484 | 388 | 323 | 215 | 193 | 92 | 118 | 255 | 162 | 542 | 623 | 314 |
| 2012 | 419 | 502 | 237 | 400 | 308 | 65 | 85 | 481 | 846 | 833 | 595 | 862 |
| 2013 | 585 | 541 | 671 | 289 | 313 | 340 | 155 | 318 | 607 | 662 | 827 | 541 |
| 2014 | 624 | 526 | 217 | 244 | 485 | 371 | 435 | 253 | 575 | 718 | 421 | 308 |
| 2015 | 258 | 460 | 411 | 161 | 103 | 136 | 185 | 390 | 275 | 634 | 379 | 296 |
| 2016 | 436 | 237 | 313 | 127 | 179 | 261 | 190 | 221 | 353 | 536 | 664 | 411 |
| 2017 | 638 | 350 | 396 | 303 | 681 | 530 | 519 | 456 | 893 | 960 | 1,068 | 1,100 |
| 2018 | 595 | 732 | 687 | 366 | 504 | 517 | 633 | 691 | 879 | 1,052 | 1,240 | 993 |
| 2019 | 938 | 801 | 721 | 688 | 799 | 644 | 919 | 1,008 | 1,491 | 2,414 | 1,832 | 1,604 |
| 2020 | 1,031 | 1,396 | 841 | 193 | 249 | 218 | 867 | 468 | 1,009 | 1,251 | 1,516 | 987 |
| 2021 | 1,615 | 1,225 | 2,210 | 1,348 | 557 | 475 | 1,256 | 806 | 1,779 | 3,276 | 3,537 | 3,198 |
| 2022 | 3,004 | 2,422 | 2,811 | 1,585 | 2,330 | 2,527 | 2,909 | 2,480 | 2,637 | 2,630 | 3,275 | 3,362 |
| 2023 | 3,593 | 3,036 | 3,368 | 2,734 | 2,938 | 2,893 | 2,665 | 3,025 | 3,786 | 3,964 | 4,040 | 3,797 |
| 2024 | 3,663 | |||||||||||
| - = No Data Reported; -- = Not Applicable; NA = Not Available; W = Withheld to avoid disclosure of individual company data. |
| Release Date: 3/29/2024 |
| Next Release Date: 4/30/2024 |