|
Download Data (XLS File) |
|
||||||||
|
||||||||
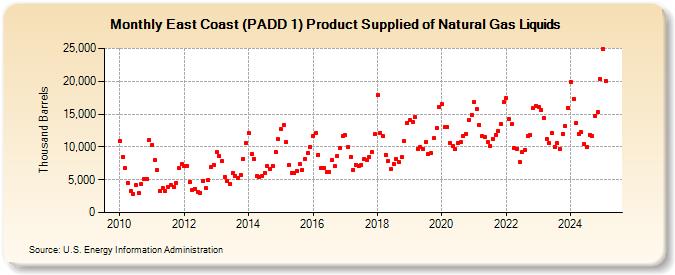
| East Coast (PADD 1) Product Supplied of Natural Gas Liquids (Thousand Barrels) | ||||||||
| Year | Jan | Feb | Mar | Apr | May | Jun | Jul | Aug | Sep | Oct | Nov | Dec |
|---|---|---|---|---|---|---|---|---|---|---|---|---|
| 2010 | 10,915 | 8,535 | 6,765 | 4,571 | 3,272 | 2,819 | 4,188 | 2,908 | 4,307 | 5,174 | 5,084 | 11,059 |
| 2011 | 10,361 | 8,000 | 6,455 | 3,234 | 3,774 | 3,264 | 3,902 | 4,165 | 3,897 | 4,564 | 6,747 | 7,361 |
| 2012 | 7,084 | 7,118 | 4,609 | 3,392 | 3,626 | 3,205 | 3,046 | 4,876 | 3,763 | 4,934 | 6,993 | 7,315 |
| 2013 | 9,254 | 8,581 | 7,828 | 5,463 | 4,878 | 4,403 | 6,000 | 5,603 | 5,224 | 5,795 | 8,206 | 10,570 |
| 2014 | 12,078 | 8,953 | 8,210 | 5,498 | 5,408 | 5,587 | 6,047 | 7,024 | 6,709 | 7,087 | 9,254 | 11,163 |
| 2015 | 12,654 | 13,354 | 10,717 | 7,217 | 6,064 | 6,013 | 6,317 | 7,398 | 6,552 | 8,140 | 9,070 | 10,050 |
| 2016 | 11,680 | 12,047 | 8,839 | 6,852 | 6,753 | 6,131 | 6,180 | 8,052 | 7,034 | 8,548 | 9,799 | 11,609 |
| 2017 | 11,761 | 9,971 | 8,475 | 6,538 | 7,212 | 7,022 | 7,219 | 8,174 | 8,018 | 8,505 | 9,207 | 11,913 |
| 2018 | 17,901 | 12,128 | 11,590 | 8,812 | 7,877 | 6,565 | 7,441 | 8,097 | 7,664 | 8,394 | 10,834 | 13,602 |
| 2019 | 14,039 | 13,832 | 14,497 | 9,728 | 10,001 | 9,734 | 10,770 | 8,910 | 9,040 | 11,338 | 12,869 | 16,129 |
| 2020 | 16,462 | 12,979 | 13,007 | 10,606 | 10,133 | 9,617 | 10,646 | 10,743 | 11,644 | 12,002 | 14,119 | 14,916 |
| 2021 | 16,911 | 15,751 | 13,354 | 11,599 | 11,509 | 10,731 | 10,141 | 11,246 | 11,885 | 12,364 | 13,447 | 16,814 |
| 2022 | 17,429 | 14,213 | 13,514 | 9,789 | 9,726 | 7,704 | 9,283 | 9,543 | 11,610 | 11,864 | 15,861 | 16,274 |
| 2023 | 15,589 | 15,718 | 12,864 | 11,482 | 10,817 | 12,374 | 9,457 | 10,669 | 9,302 | 12,056 | 13,125 | 14,608 |
| 2024 | 19,649 | |||||||||||
| - = No Data Reported; -- = Not Applicable; NA = Not Available; W = Withheld to avoid disclosure of individual company data. |
| Release Date: 3/29/2024 |
| Next Release Date: 4/30/2024 |