|
Download Data (XLS File) |
|
||||||||
|
||||||||
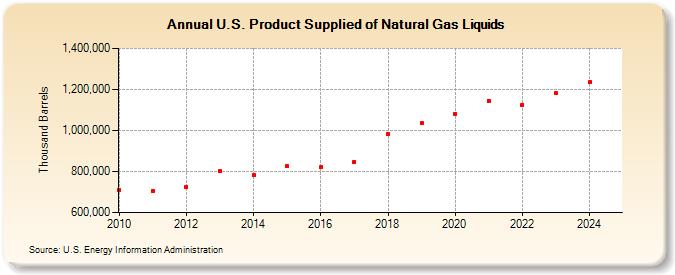
| U.S. Product Supplied of Natural Gas Liquids (Thousand Barrels) | ||||||||
| Decade | Year-0 | Year-1 | Year-2 | Year-3 | Year-4 | Year-5 | Year-6 | Year-7 | Year-8 | Year-9 |
|---|---|---|---|---|---|---|---|---|---|---|
| 2010's | 710,443 | 705,130 | 724,300 | 802,180 | 782,315 | 824,796 | 820,052 | 848,131 | 983,385 | 1,036,605 |
| 2020's | 1,080,907 | 1,145,069 | 1,124,997 | 1,163,699 |
| - = No Data Reported; -- = Not Applicable; NA = Not Available; W = Withheld to avoid disclosure of individual company data. |
| Release Date: 4/30/2024 |
| Next Release Date: 8/30/2024 |