|
Download Data (XLS File) |
|
||||||||
|
||||||||
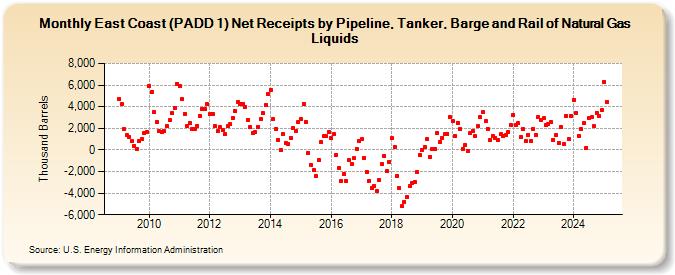
| East Coast (PADD 1) Net Receipts by Pipeline, Tanker, Barge and Rail of Natural Gas Liquids (Thousand Barrels) | ||||||||
| Year | Jan | Feb | Mar | Apr | May | Jun | Jul | Aug | Sep | Oct | Nov | Dec |
|---|---|---|---|---|---|---|---|---|---|---|---|---|
| 2009 | 4,758 | 4,239 | 1,947 | 1,347 | 1,223 | 782 | 402 | 126 | 794 | 1,005 | 1,525 | 1,646 |
| 2010 | 5,932 | 5,396 | 3,550 | 2,590 | 1,710 | 1,650 | 1,709 | 2,203 | 2,760 | 3,375 | 3,856 | 6,127 |
| 2011 | 5,921 | 4,692 | 3,369 | 2,222 | 2,481 | 1,972 | 1,935 | 2,222 | 3,134 | 3,784 | 3,824 | 4,218 |
| 2012 | 3,323 | 3,301 | 2,180 | 1,717 | 2,088 | 1,803 | 1,428 | 2,187 | 2,370 | 2,955 | 3,589 | 4,429 |
| 2013 | 4,291 | 4,285 | 3,984 | 2,807 | 2,075 | 1,587 | 1,639 | 2,131 | 2,870 | 3,386 | 4,138 | 5,163 |
| 2014 | 5,587 | 2,828 | 1,932 | 938 | -15 | 1,429 | 658 | 580 | 1,114 | 2,065 | 1,770 | 2,568 |
| 2015 | 2,815 | 4,266 | 2,607 | -246 | -1,386 | -1,873 | -2,378 | -974 | 731 | 1,246 | 1,255 | 1,637 |
| 2016 | 1,124 | 1,430 | -448 | -1,655 | -2,904 | -2,232 | -2,868 | -970 | -1,289 | -789 | 107 | 805 |
| 2017 | 985 | -753 | -2,034 | -2,872 | -3,530 | -3,351 | -3,827 | -2,796 | -1,338 | -553 | -1,954 | -1,097 |
| 2018 | 1,067 | 284 | -2,436 | -3,539 | -5,231 | -4,842 | -4,356 | -3,385 | -3,026 | -2,946 | -2,052 | -450 |
| 2019 | 29 | 231 | 1,003 | -629 | 41 | 109 | 1,540 | 729 | 1,145 | 1,436 | 1,497 | 3,026 |
| 2020 | 2,641 | 1,325 | 2,495 | 1,924 | 105 | 459 | -68 | 1,521 | 1,773 | 1,262 | 2,168 | 3,052 |
| 2021 | 3,502 | 2,678 | 1,974 | 937 | 1,318 | 1,106 | 910 | 1,427 | 1,329 | 1,345 | 1,679 | 2,299 |
| 2022 | 3,186 | 2,306 | 2,448 | 1,207 | 1,950 | 780 | 1,413 | 818 | 1,941 | 1,404 | 3,040 | 2,797 |
| 2023 | 2,913 | 2,303 | 439 | 1,807 | 910 | 1,382 | 663 | 2,080 | 595 | 3,142 | 1,026 | 2,165 |
| 2024 | 4,375 | |||||||||||
| - = No Data Reported; -- = Not Applicable; NA = Not Available; W = Withheld to avoid disclosure of individual company data. |
| Release Date: 3/29/2024 |
| Next Release Date: 4/30/2024 |